

Covering chemical diversity of genetically-modified tomatoes using metabolomics for objective substantial equivalence assessment
- PMID: 21359231
- PMCID: PMC3040210
- DOI: 10.1371/journal.pone.0016989
Covering chemical diversity of genetically-modified tomatoes using metabolomics for objective substantial equivalence assessment
Abstract
As metabolomics can provide a biochemical snapshot of an organism's phenotype it is a promising approach for charting the unintended effects of genetic modification. A critical obstacle for this application is the inherently limited metabolomic coverage of any single analytical platform. We propose using multiple analytical platforms for the direct acquisition of an interpretable data set of estimable chemical diversity. As an example, we report an application of our multi-platform approach that assesses the substantial equivalence of tomatoes over-expressing the taste-modifying protein miraculin. In combination, the chosen platforms detected compounds that represent 86% of the estimated chemical diversity of the metabolites listed in the LycoCyc database. Following a proof-of-safety approach, we show that % had an acceptable range of variation while simultaneously indicating a reproducible transformation-related metabolic signature. We conclude that multi-platform metabolomics is an approach that is both sensitive and robust and that it constitutes a good starting point for characterizing genetically modified organisms.
Conflict of interest statement
Figures

 ), which states that the genetically modified organism (GMO) deviates more from the control line than a panel of traditional cultivars, against the alternative hypothesis of SE (
 ). (b) The second task is to look for discriminative features [e.g. metabolite (met) A, met B and met C] between the transgenic line and the control to obtain an understanding of the consequences of the incurred effects. (c) The proposed work-flow. Samples are analyzed on three analytical platforms. The resulting data sets are summarized to consensus, non-redundant data sets with the help of the MetMask metabolite identifier management tool . The achieved coverage is evaluated by comparing the chemical properties of the detected metabolites with a reference metabolome in the literature. A proof-of-safety approach is used to quantify the evidence for safe metabolite levels; multivariate discrimination analysis is used to characterize the unintended effects.

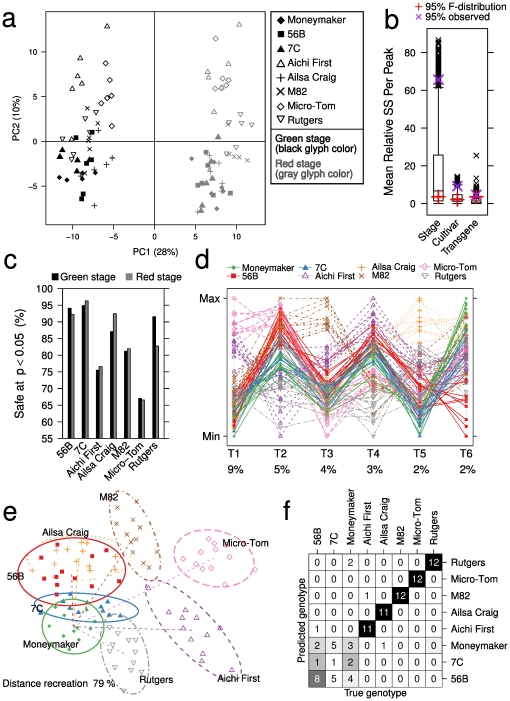
 . Factors with separated observed- and F-distribution percentiles indicate the overall significance of that factor. (c) The ratio of peaks considered to indicate safety at a significance level of
  compared to the Moneymaker line. For comparison purposes, the test was applied to the transgenic lines and the traditional cultivars. (d) Parallel coordinates plot of the predictive components from the OPLS-DA model. Each biological sample is drawn as a line that connects its positions on each of the components. Each dimension describes a unique aspect of the genotype-correlated variance among the metabolite profiles. All genotypes except 7C and Moneymaker are separated on at least one axis. Percentages indicate the ratio of total variance explained by the corresponding dimension. (e) Result from Sammon's MDS of distances computed using the six predictive OPLS-DA components shown in (d). (f) Confusion matrix for predicting the genotype using the OPLS-DA model during five-fold cross-validation.
 (56B and 7C) are correlated to the genotype; the
  components (56B and 7C) are orthogonal. (a–b) Score plot for the OPLS-DA model between 56B and MM using data from the soil experiment and (b) 7C and MM (b). (c) Correlation loading plots show the well-described peaks. The correlation indicates an overlap between the metabolites that are used to isolate 56B and 7C. The two models associate 4% and 6% of the variance to the genetic modification of 56B and 7C, respectively. (d–f) OPLS-DA models using the metabolite profiles of tomatoes grown on HC solution. (g) Overlap between the metabolites used to discriminate 7C and Moneymaker using metabolite profiles from soil and HC experiments. Asparagine (Asp) levels are lower in 7C than MM and the proline (Pro) levels are higher. Metabolite abbreviations are shown in Data S5 in File S2.
References
-
- OECD. An introduction to the food/feed safety consensus documents of the Task Force. Series on the Safety of Novel Foods and Feeds. 2006;14:ENV/JM/MONO(2006)10.
-
- Kok EJ, Keijer J, Kleter GA, Kuiper HA. Comparative safety assessment of plant-derived foods. Regul Toxicol Pharmacol. 2008;50:98–113. - PubMed
-
- Kuiper HA, Kleter GA, Noteborn HP, Kok EJ. Assessment of the food safety issues related to genetically modified foods. Plant J. 2001;27:503–528. - PubMed
-
- Kok EJ, van Hal NLWF, Winnubst LNW, Kramer EHM, Dijksma WTP, et al. Assessment of representational difference analysis (RDA) to construct informative cDNA microarrays for gene expression analysis of species with limited transcriptome information, using red and green tomatoes as a model. J Plant Physiol. 2007;164:337–349. - PubMed
-
- Barros E, Lezar S, Anttonen MJ, van Dijk JP, Rhlig RM, et al. Comparison of two GM maize varieties with a near-isogenic non-GM variety using transcriptomics, proteomics and metabolomics. Plant Biotechnol J. 2010;8:436–451. - PubMed
Publication types
MeSH terms
Substances
LinkOut - more resources
Full Text Sources
Research Materials
