. 2011 Jun;65(6):1661-9.
doi: 10.1002/mrm.22756. Epub 2011 Feb 28.

Accelerated cardiac T2 mapping using breath-hold multiecho fast spin-echo pulse sequence with k-t FOCUSS

Affiliations

Accelerated cardiac T2 mapping using breath-hold multiecho fast spin-echo pulse sequence with k-t FOCUSS

Li Feng et al. Magn Reson Med. 2011 Jun.

Abstract

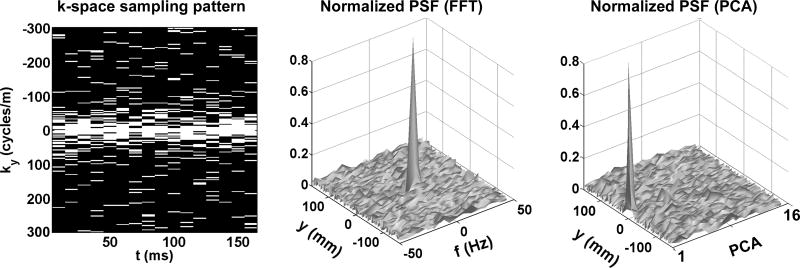
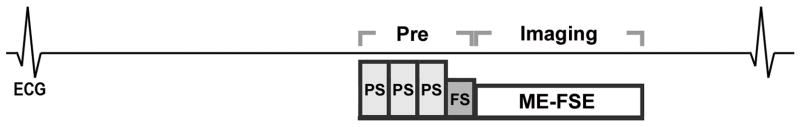
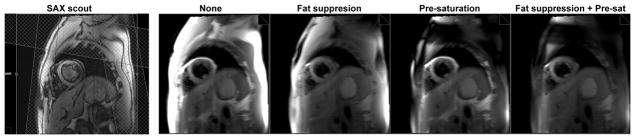
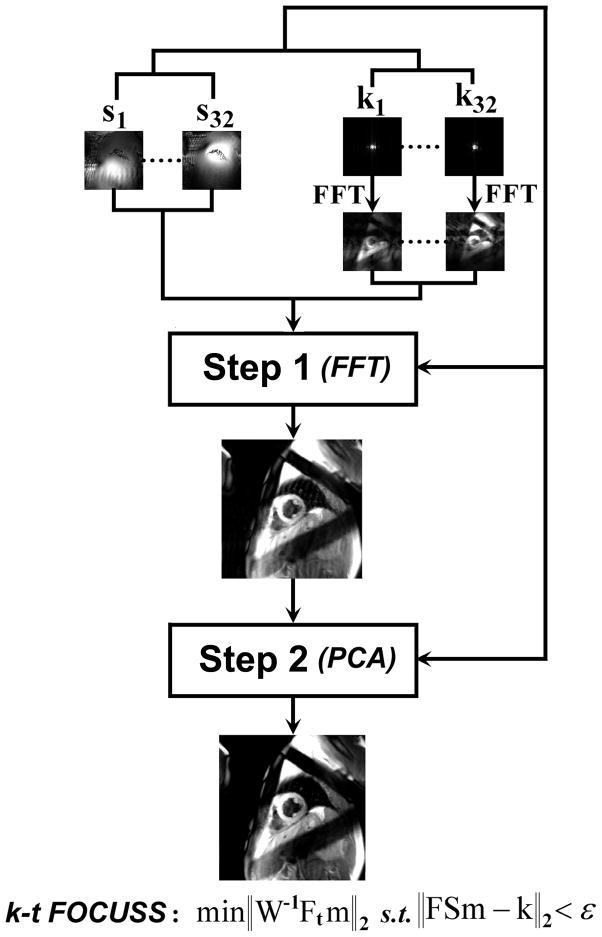
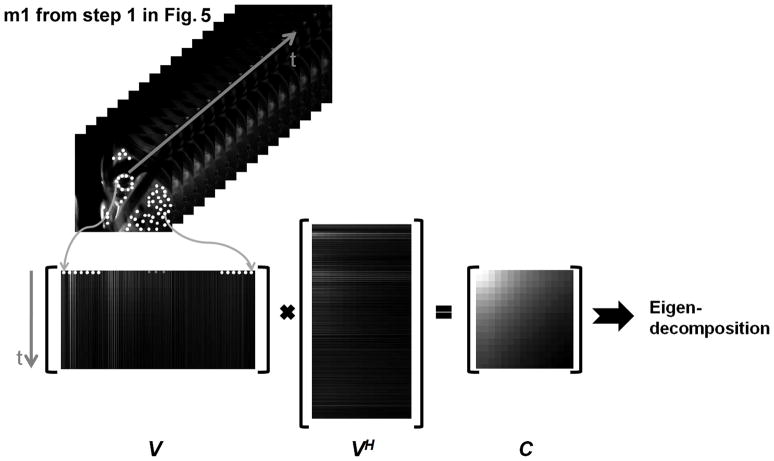
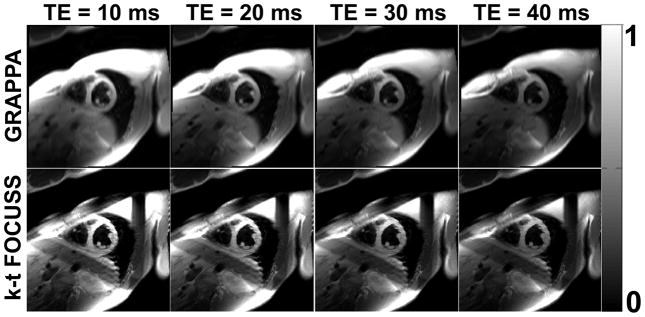
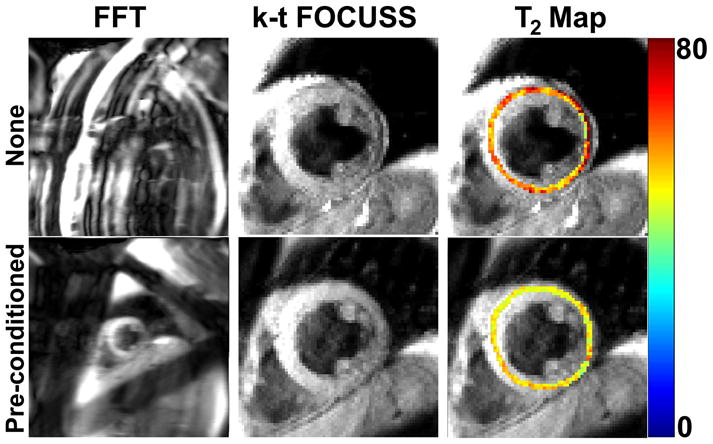
Cardiac T(2) mapping is a promising method for quantitative assessment of myocardial edema and iron overload. We have developed a new multiecho fast spin echo (ME-FSE) pulse sequence for breath-hold T(2) mapping with acceptable spatial resolution. We propose to further accelerate this new ME-FSE pulse sequence using k-t focal underdetermined system solver adapted with a framework that uses both compressed sensing and parallel imaging (e.g., sensitivity encoding) to achieve higher spatial resolution. We imaged 12 control subjects in midventricular short-axis planes and compared the accuracy of T(2) measurements obtained using ME-FSE with generalized autocalibrating partially parallel acquisitions and ME-FSE with k-t focal underdetermined system solver. For image reconstruction, we used a bootstrapping two-step approach, where in the first step fast Fourier transform was used as the sparsifying transform and in the final step principal component analysis was used as the sparsifying transform. When compared with T(2) measurements obtained using generalized autocalibrating partially parallel acquisitions, T(2) measurements obtained using k-t focal underdetermined system solver were in excellent agreement (mean difference = 0.04 msec; upper/lower 95% limits of agreement were 2.26/-2.19 msec, respectively). The proposed accelerated ME-FSE pulse sequence with k-t focal underdetermined system solver is a promising investigational method for rapid T(2) measurement of the heart with relatively high spatial resolution (1.7 × 1.7 mm(2) ).


Figures

Figure 1
Figure 1
(Left) 6-fold accelerated ky-t sampling pattern based on FOV = 320 mm × 320 mm, inter-image spacing = 10 ms, and number of images = 16. (Middle) Corresponding PSF in the sparse y-f space using FFT as the sparsifying transform. Ratio of the peak and standard deviation of PSF was 32.4. (Right) Corresponding PSF in the sparse y-PCA space using PCA as the sparsifying transform. Ratio of the peak and standard deviation of PSF was 31.7.
Figure 2
Figure 2
(a) Monoexponential decay curve representing the transverse magnetization (Mxy) of ME-FSE. b) FFT representation of a) and c) PCA representation of a). These plots clearly show that a monoexponential decay curve is sparser in PCA than in FFT domain. To further validate this finding, a reference ME-FSE series is displayed in both d) FFT and e) PCA domains. Both domains are displayed with identical grayscale of 0 – 1000 arbitrary unit (a.u.). The results were consistent with the ideal curves shown (a-c). These preliminary results prove that PCA is a superior sparsifying transform than FFT for T2 mapping with ME-FSE, and confirms the rationale behind the use of PCA in previous T2 mapping studies with CS (–19).
Figure 3
Figure 3
Schematic diagram of the proposed accelerated T2 mapping pulse sequence with pre-conditioning RF pulses. Electrocardiogram triggering was used to image at mid to late diastole, to image at a cardiac phase where there is minimal cardiac motion. Three pre-saturation RF modules and a single fat suppression module were applied prior to ME-FSE readout as shown. These diagrams are drawn to approximate proportions but not exact scales. ECG: electrocardiogram; Pre: pre-conditioning; PS: pre-saturation; FS: fat suppression.
Figure 4
Figure 4
Representative (column 1) short-axis scout image displaying positions and thicknesses of three pre-saturation RF pulses (displayed as meshed-strip lines). Resulting ME-FSE images with GRAPPA at TE = 10 ms: (column 2) none, (column 3) fat suppression, (column 4) three pre-saturation RF pulses, and (column 5) fat suppression and three pre-saturation RF pulses. Between the four cases, the combined use of fat suppression and pre-saturation RF pulses produced the best suppression of bright signals unrelated to the heart.
Figure 5
Figure 5
Schematic flowchart of the two-step reconstruction methods. In step 1, coil sensitivity maps and multi-coil k-space data were used to perform preliminary reconstruction using FFT as the sparsifying transform. In step 2, m1 was used to estimate a basis set for PCA. The resulting PCA basis set, coil sensitivity maps, and multi-coil k-space data were used to perform the final reconstruction (m2). m1: reconstructed image using FFT as the sparsifying transform; m2: reconstructed image using PCA as the sparsifying transform; s.t.: subject to; ε: noise level. See Figure 6 for schematic details on step 2.
Figure 6
Figure 6
Schematics details of estimating a PCA basis. Results from step 1 (i.e., m1) in Figure 5 are shown in upper left. By concatenating each time signal vector along column direction, a matrix V is constructed. Then, by conducting eigen-decomposition of the covariance matrix C of V, a basis set for PCA is estimated.
Figure 7
Figure 7
Representative ME-FSE images acquired using the reference and accelerated T2 mapping pulse sequences: (top row) GRAPPA and (bottom row) k-t FOCUSS. Compared with GRAPPA, k-t FOCUSS consistently yielded higher spatial resolution in the phase-encoding direction (1.7 mm × 1.7 mm vs. 1.7 mm × 4.2 mm; accelerated vs. reference, respectively).
Figure 8
Figure 8
Zoomed ME-FSE image series corresponding to Figure 7: (top row) GRAPPA and (bottom row) k-t FOCUSS. Mean T2 values of this subject resulting from GRAPPA and k-t FOCUSS were 51.7 ± 3.6 and 51.6 ± 4.0, respectively. Compared with GRAPPA image, k-t FOCUSS image yielded higher spatial resolution in the phase-encoding direction, as shown by the intensity profiles of the muscle-blood border.
Figure 9
Figure 9
Example ME-FSE images and the corresponding T2 maps with and without pre-conditioning RF pulses. For the latter case, note the signal heterogeneity in the k-t FOCUSS reconstruction, particularly in the lateral wall, as well as the corresponding T2 error. In this subject, the mean T2 measurements within the segmented myocardium were 50.0 ± 4.0 ms and 60.8 ± 12.9 ms for with and without pre-conditioning RF pulses, respectively. These results are corroborated with zero-filled FFT reconstruction images which show more residual aliasing artifacts for the latter case. These results clearly demonstrate the usefulness of increasing sparsity in ME-FSE through the use of preconditioning RF pulses.

References

    1. Hennig J, Nauerth A, Friedburg H. RARE imaging: a fast imaging method for clinical MR. Magnetic Resonance in Medicine. 1986;3(6):823–833. - PubMed
    1. Simonetti OP, Finn JP, White RD, Laub G, Henry DA. “Black blood” T2-weighted inversion-recovery MR imaging of the heart. Radiology. 1996;199(1):49–57. - PubMed
    1. Abdel-Aty H, Zagrosek A, Schulz-Menger J, Taylor AJ, Messroghli D, Kumar A, Gross M, Dietz R, Friedrich MG. Delayed enhancement and T2-weighted cardiovascular magnetic resonance imaging differentiate acute from chronic myocardial infarction. Circulation. 2004;109(20):2411–2416. - PubMed
    1. Cury RC, Shash K, Nagurney JT, Rosito G, Shapiro MD, Nomura CH, Abbara S, Bamberg F, Ferencik M, Schmidt EJ, Brown DF, Hoffmann U, Brady TJ. Cardiac magnetic resonance with T2-weighted imaging improves detection of patients with acute coronary syndrome in the emergency department. Circulation. 2008;118(8):837–844. - PubMed
    1. Friedrich MG, Abdel-Aty H, Taylor A, Schulz-Menger J, Messroghli D, Dietz R. The salvaged area at risk in reperfused acute myocardial infarction as visualized by cardiovascular magnetic resonance. Journal of the American College of Cardiology. 2008;51(16):1581–1587. - PubMed

Publication types