

Patient-specific radiation dose and cancer risk estimation in CT: part I. development and validation of a Monte Carlo program
- PMID: 21361208
- PMCID: PMC3021562
- DOI: 10.1118/1.3515839
Patient-specific radiation dose and cancer risk estimation in CT: part I. development and validation of a Monte Carlo program
Abstract
Purpose: Radiation-dose awareness and optimization in CT can greatly benefit from a dose-reporting system that provides dose and risk estimates specific to each patient and each CT examination. As the first step toward patient-specific dose and risk estimation, this article aimed to develop a method for accurately assessing radiation dose from CT examinations.
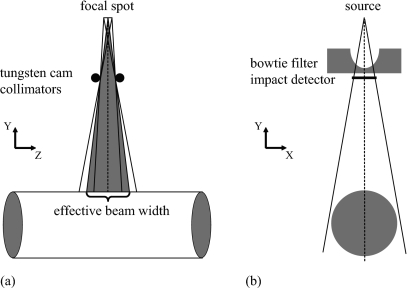
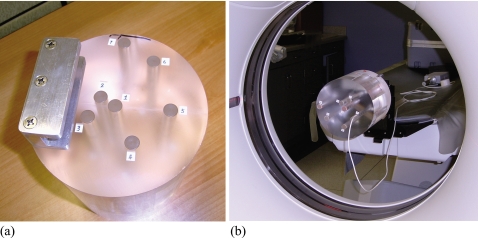
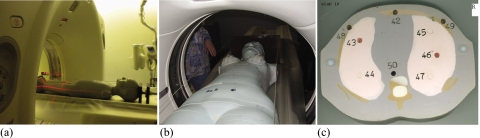
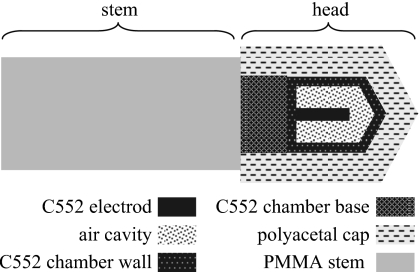
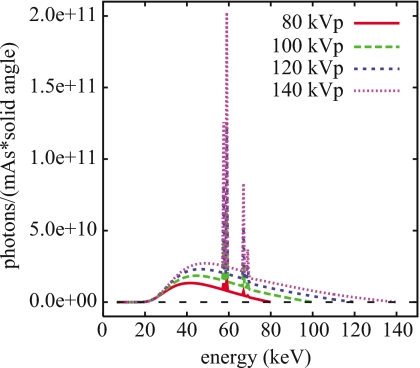
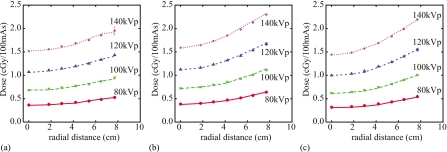
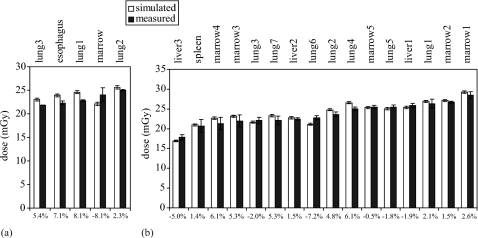
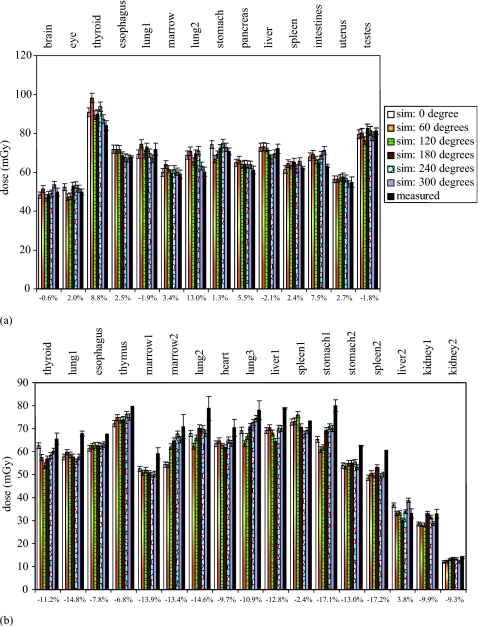
Methods: A Monte Carlo program was developed to model a CT system (LightSpeed VCT, GE Healthcare). The geometry of the system, the energy spectra of the x-ray source, the three-dimensional geometry of the bowtie filters, and the trajectories of source motions during axial and helical scans were explicitly modeled. To validate the accuracy of the program, a cylindrical phantom was built to enable dose measurements at seven different radial distances from its central axis. Simulated radial dose distributions in the cylindrical phantom were validated against ion chamber measurements for single axial scans at all combinations of tube potential and bowtie filter settings. The accuracy of the program was further validated using two anthropomorphic phantoms (a pediatric one-year-old phantom and an adult female phantom). Computer models of the two phantoms were created based on their CT data and were voxelized for input into the Monte Carlo program. Simulated dose at various organ locations was compared against measurements made with thermoluminescent dosimetry chips for both single axial and helical scans.
Results: For the cylindrical phantom, simulations differed from measurements by -4.8% to 2.2%. For the two anthropomorphic phantoms, the discrepancies between simulations and measurements ranged between (-8.1%, 8.1%) and (-17.2%, 13.0%) for the single axial scans and the helical scans, respectively.
Conclusions: The authors developed an accurate Monte Carlo program for assessing radiation dose from CT examinations. When combined with computer models of actual patients, the program can provide accurate dose estimates for specific patients.
Figures
Similar articles
-
A Monte Carlo based method to estimate radiation dose from multidetector CT (MDCT): cylindrical and anthropomorphic phantoms.Phys Med Biol. 2005 Sep 7;50(17):3989-4004. doi: 10.1088/0031-9155/50/17/005. Epub 2005 Aug 11. Phys Med Biol. 2005. PMID: 16177525
-
Monte Carlo simulations of adult and pediatric computed tomography exams: validation studies of organ doses with physical phantoms.Med Phys. 2013 Jan;40(1):013901. doi: 10.1118/1.4771934. Med Phys. 2013. PMID: 23298124 Free PMC article.
-
Validation of a Monte Carlo model used for simulating tube current modulation in computed tomography over a wide range of phantom conditions/challenges.Med Phys. 2014 Nov;41(11):112101. doi: 10.1118/1.4887807. Med Phys. 2014. PMID: 25370652 Free PMC article.
-
Validation of a deterministic linear Boltzmann transport equation solver for rapid CT dose computation using physical dose measurements in pediatric phantoms.Med Phys. 2021 Dec;48(12):8075-8088. doi: 10.1002/mp.15301. Epub 2021 Oct 29. Med Phys. 2021. PMID: 34669975 Free PMC article.
-
Patient-specific radiation dose and cancer risk estimation in CT: part II. Application to patients.Med Phys. 2011 Jan;38(1):408-19. doi: 10.1118/1.3515864. Med Phys. 2011. PMID: 21361209 Free PMC article.
Cited by
-
Effect of ROI filtering in 3D cone-beam rotational angiography on organ dose and effective dose in cerebral investigations.J Appl Clin Med Phys. 2015 Mar 8;16(2):5306. doi: 10.1120/jacmp.v16i2.5306. J Appl Clin Med Phys. 2015. PMID: 26103200 Free PMC article.
-
Development and validation of an open source Monte Carlo dosimetry model for wide-beam CT scanners using Fluka.J Appl Clin Med Phys. 2019 Apr;20(4):132-147. doi: 10.1002/acm2.12559. Epub 2019 Mar 9. J Appl Clin Med Phys. 2019. PMID: 30851155 Free PMC article.
-
Virtual clinical trials in medical imaging: a review.J Med Imaging (Bellingham). 2020 Jul;7(4):042805. doi: 10.1117/1.JMI.7.4.042805. Epub 2020 Apr 11. J Med Imaging (Bellingham). 2020. PMID: 32313817 Free PMC article. Review.
-
Size-based quality-informed framework for quantitative optimization of pediatric CT.J Med Imaging (Bellingham). 2017 Jul;4(3):031209. doi: 10.1117/1.JMI.4.3.031209. Epub 2017 Aug 21. J Med Imaging (Bellingham). 2017. PMID: 28840168 Free PMC article.
-
Effects of protocol and obesity on dose conversion factors in adult body CT.Med Phys. 2012 Nov;39(11):6550-71. doi: 10.1118/1.4754584. Med Phys. 2012. PMID: 23127050 Free PMC article.
References
-
- NCRP, “Ionizing radiation exposure of the population of the United States,” NCRP Report No. 160 (National Council on Radiation Protection and Measurements, Bethesda, MD, 2009).
-
- ICRP, Managing Patient Dose in Multi-Detector Computed Tomography (MDCT): ICRP Publication 102 (International Commission on Radiological Protection, Essen, 2007). - PubMed
-
- AAPM Task Group 23, “The measurement, reporting, and management of radiation dose in CT,” AAPM Report No. 96 (American Association of Physicists in Medicine, College Park, MD, 2008).
-
- Goske M. J., Applegate K. E., Boylan J., Butler P. F., Callahan M. J., Coley B. D., Farley S., Frush D. P., Hernanz-Schulman M., Jaramillo D., Johnson N. D., Kaste S. C., Morrison G., Strauss K. J., and Tuggle N., “The “Image Gently” campaign: Increasing CT radiation dose awareness through a national education and awareness program,” Pediatr. Radiol. PDRYA5 38, 265–269 (2008).10.1007/s00247-007-0743-3 - DOI - PubMed
-
- E. S.Amis, Jr., Butler P. F., Applegate K. E., Birnbaum S. B., Brateman L. F., Hevezi J. M., Mettler F. A., Morin R. L., Pentecost M. J., Smith G. G., Strauss K. J., and Zeman R. K., “American College of Radiology white paper on radiation dose in medicine,” J. Am. Coll. Radiol. ZZZZZZ 4, 272–284 (2007).10.1016/j.jacr.2007.03.002 - DOI - PubMed
Publication types
MeSH terms
Grants and funding
LinkOut - more resources
Full Text Sources
Other Literature Sources
Medical
Research Materials
