. 2011 Feb;129(2):852-63.
doi: 10.1121/1.3523476.

Auditory filter shapes and high-frequency hearing in adults who have impaired speech in noise performance despite clinically normal audiograms

Affiliations

Auditory filter shapes and high-frequency hearing in adults who have impaired speech in noise performance despite clinically normal audiograms

Rohima Badri et al. J Acoust Soc Am. 2011 Feb.

Abstract

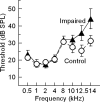
Some individuals complain of hearing difficulties in the presence of background noise even in the absence of clinically significant hearing loss (obscure auditory dysfunction). Previous evidence suggests that these listeners have impaired frequency resolution, but there has been no thorough characterization of auditory filter shapes in this population. Here, the filter shapes of adults (n = 14) who self-reported speech recognition problems in noise and performed poorly on a sentence-in-noise perception test despite having clinically normal audiograms were compared to those of controls (n = 10). The filter shapes were evaluated using a 2-kHz probe with a fixed level of 30, 40, or 50 dB sound pressure level (SPL) and notched-noise simultaneous maskers that were varied in level to determine the masker level necessary to just mask the probe. The filters of the impaired group were significantly wider than those of controls at all probe levels owing to an unusual broadening of the upper slope of the filter. In addition, absolute thresholds were statistically indistinguishable between the groups at the standard audiometric frequencies, but were elevated in the impaired listeners at higher frequencies. These results strengthen the idea that this population has a variety of hearing deficits that go undetected by standard audiometry.


Figures
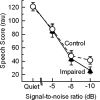
Figure 1
Figure 1
Mean performance on the sentence-in-noise perception test for the impaired listeners (triangles; n = 14) and controls (circles; n = 10). The sentences were presented in quiet and in the presence of speech-spectrum-shaped noise at three different SNRs. Percent-correct scores were transformed to rau scores. Error bars represent ±1 SD of the mean across listeners.
Figure 2
Figure 2
Mean absolute thresholds expressed as eardrum SPL as a function of frequency for impaired listeners (filled triangles; n = 13) and controls (open circles; n = 10). The error bars represent ±1 SE of the mean across listeners.
Figure 3
Figure 3
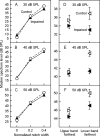
Mean raw masked thresholds for the symmetrical (left column) and asymmetrical (right column) notches for a 2-kHz probe at three different probe levels (a,d) 30 dB SPL, (b,e) 40 dB SPL, and (c,f) 50 dB SPL. Results for the symmetrical notches are shown as a function of normalized notch width for impaired listeners (filled triangles; n = 14) and controls (open circles; n = 10). Results for the asymmetrical notches are shown for conditions in which the normalized notch widths were 0.4 and 0.2 (lower-band farthest; left-facing triangles) or 0.2 and 0.4 (upper-band farthest; right-facing triangles) for impaired listeners (filled symbols) and controls (open symbols). Error bars represent ±1 SE of the mean across listeners. The mean SE calculated across all notch conditions ranged from 0.76 to 1.03 for the impaired listeners and from 0.79 to 1.35 for the controls over the three probe levels.
Figure 4
Figure 4
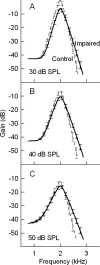
Mean auditory filter shapes, fitted with the roex model, of the impaired listeners (bold solid line) and controls (dashed thin line) for probe levels of (a) 30, (b) 40, and (c) 50 dB SPL. All of the filter shapes of the impaired listeners are normalized to have the same gain as controls at slightly more than 1 octave below the 2-kHz center frequency. Error bars represent ±1 SE of the mean across listeners.
Figure 5
Figure 5
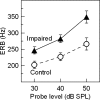
Mean ERBs as a function of probe level in impaired listeners (filled triangles) and controls (open circles). Error bars represent ±1 SE of the mean across listeners.
Figure 6
Figure 6
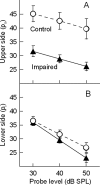
Mean values of (a) upper slopes (pu) and (b) lower slopes (pl) as a function of probe level for impaired listeners (filled triangles) and controls (open circles). Error bars represent ±1 SE of the mean across listeners.

References

    1. Baer, T., and Moore, B. C. J. (1993). “Effects of spectral smearing on the intelligibility of sentences in noise,” J. Acoust. Soc. Am. 94, 1229–1240.10.1121/1.408176 - DOI - PubMed
    1. Baker, R. J., and Rosen, S. (2002). “Auditory filter nonlinearity in mild/moderate hearing impairment,” J. Acoust. Soc. Am. 111, 1330–1339.10.1121/1.1448516 - DOI - PubMed
    1. Baker, R. J., and Rosen, S. (2006). “Auditory filter nonlinearity across frequency using simultaneous notched-noise masking,” J. Acoust. Soc. Am. 119, 454–462.10.1121/1.2139100 - DOI - PubMed
    1. Bellis, T. J. (2003). “Comprehensive central auditory assessment,” in Assessment and Management of Central Auditory Processing Disorders in the Educational Setting: From Science to Practice, 2nd ed. (Thomson Learning, Clifton Park, NY: ), pp. 240–280.
    1. Bench, J., and Bamford, J. (Ed.). (1979). Speech-Hearing Tests and the Spoken—Language of Hearing—impaired Children (Academic Press, London: ).

Publication types