. 2011 Feb;16(2):026012.
doi: 10.1117/1.3540668.

3-D photoacoustic and pulse echo imaging of prostate tumor progression in the mouse window chamber

Affiliations

3-D photoacoustic and pulse echo imaging of prostate tumor progression in the mouse window chamber

Daniel R Bauer et al. J Biomed Opt. 2011 Feb.

Abstract

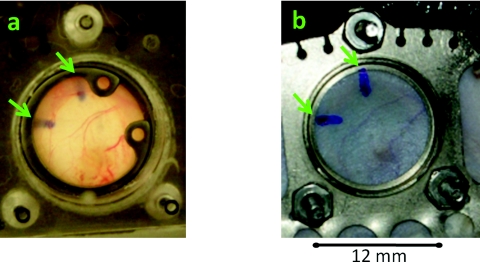
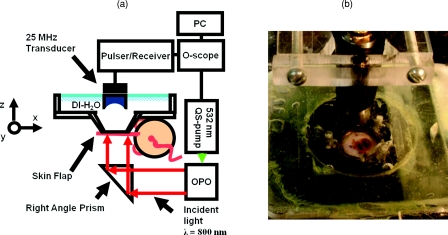
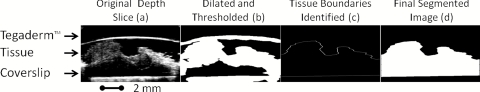
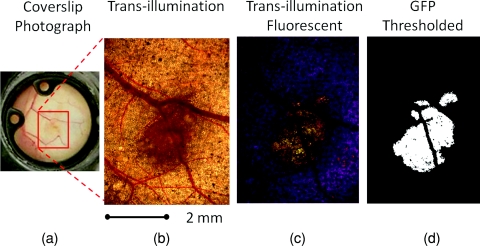
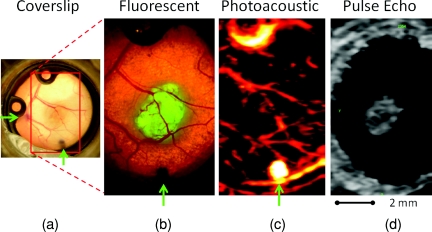
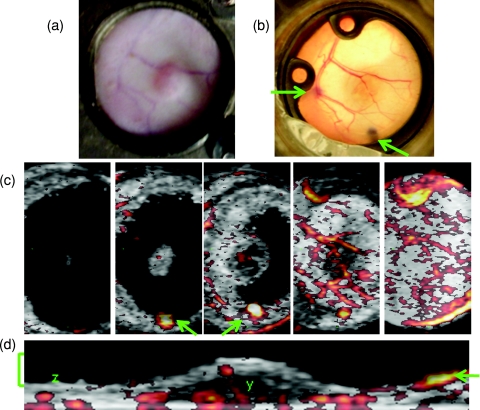
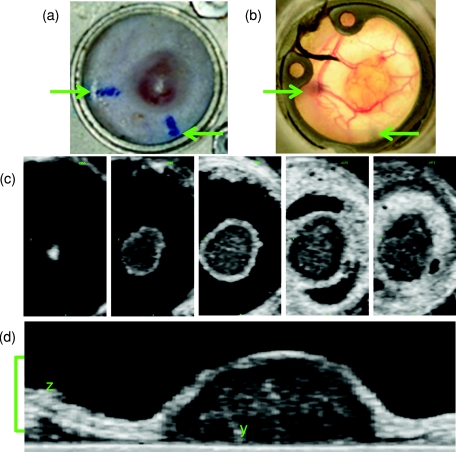
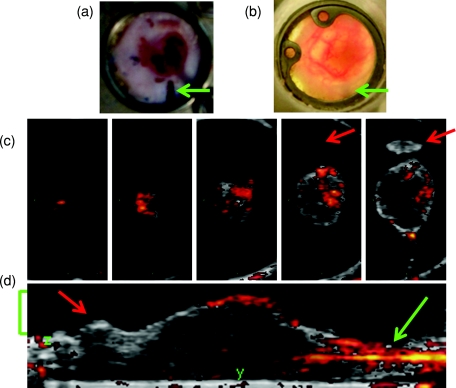
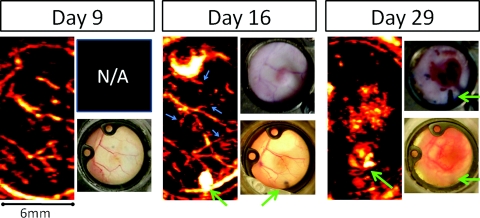
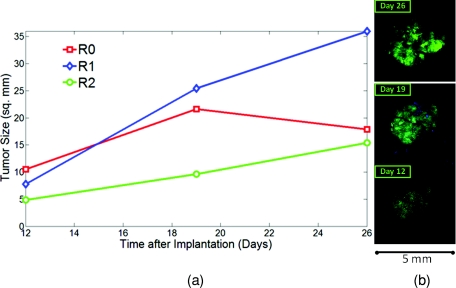
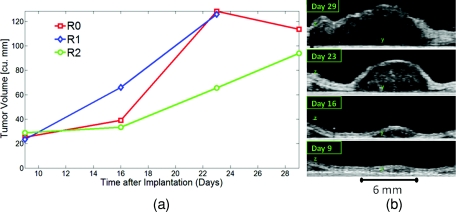
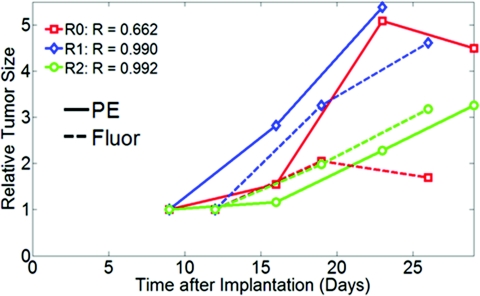
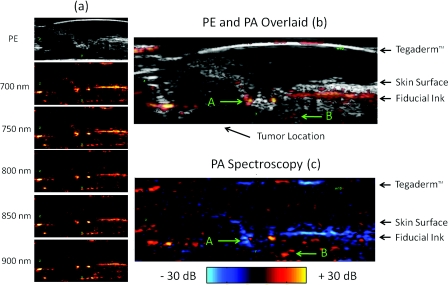
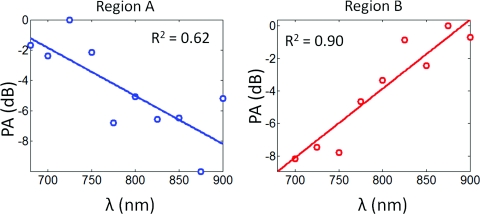
Understanding the tumor microenvironment is critical to characterizing how cancers operate and predicting their response to treatment. We describe a novel, high-resolution coregistered photoacoustic (PA) and pulse echo (PE) ultrasound system used to image the tumor microenvironment. Compared to traditional optical systems, the platform provides complementary contrast and important depth information. Three mice are implanted with a dorsal skin flap window chamber and injected with PC-3 prostate tumor cells transfected with green fluorescent protein. The ensuing tumor invasion is mapped during three weeks or more using simultaneous PA and PE imaging at 25 MHz, combined with optical and fluorescent techniques. Pulse echo imaging provides details of tumor structure and the surrounding environment with 100-μm(3) resolution. Tumor size increases dramatically with an average volumetric growth rate of 5.35 mm(3)/day, correlating well with 2-D fluorescent imaging (R = 0.97, p < 0.01). Photoacoustic imaging is able to track the underlying vascular network and identify hemorrhaging, while PA spectroscopy helps classify blood vessels according to their optical absorption spectrum, suggesting variation in blood oxygen saturation. Photoacoustic and PE imaging are safe, translational modalities that provide enhanced depth resolution and complementary contrast to track the tumor microenvironment, evaluate new cancer therapies, and develop molecular contrast agents in vivo.


Figures

Figure 1
Figure 1
Photographs of window chamber from mouse R1 on day 9 postimplantation: (a) Photograph from coverslip side and (b) photograph (mirror image) from skin side. The three screws on the chamber were used to secure the window chamber to the imaging apparatus. The arrows denote the fiducial ink mark placed on the skin. The window chamber had a diameter of 12 mm. (Color online only.)
Figure 2
Figure 2
(a) Diagram of the PA and PE imaging setup. (b) Photograph of the 25-MHz transducer facing the skin side of the window chamber mounted in the water bath. The transducer was raster scanned across the window chamber, while light illuminated the coverslip from below. The synchronization between the laser firing (for PA) and transducer excitation (for PE) enabled simultaneous acquisition.
Figure 3
Figure 3
Graphical representation of PE image segmentation algorithm used to calculate tumor volume: (a) Original PE depth slice (gray, 22 dB) of tumor from mouse R0 on day 23, (b) PE image after filtering, dilation and thresholding, (c) TegadermTM and coverslip removed, revealing upper and lower tissue boundaries (edge of coverslip represented the lower tissue boundary), and (d) final segmented image.
Figure 4
Figure 4
(Left to Right) Coverslip photograph (day 9); transillumination (day 12); transillumination fluorescent image (day 12); and thresholded GFP fluorescent image (day 12) of mouse R2. Red-scale box has dimensions of approximately 4×6 mm.
Figure 5
Figure 5
Example of multimodality images of mouse R2 (Left to Right): Coverslip photograph (day 16), fluorescent image revealing GFP-expressing cells and nearby blood vessels (day 19), maximum projection PA image (λ = 800 nm, 30 dB, day 16), and lateral PE image of the protruding tumor close to the skin surface (30 dB, day 16). Each modality provides different contrast and spatial detail. Location of GFP is revealed in fluorescent image, blood vessel locations are displayed in PA image, and the tumor’s depth profile and physical structure are displayed in the PE image. The arrows denote the fiducial ink mark placed on the skin. Scale box has dimensions of 6×11 mm. (Color online only.)
Figure 6
Figure 6
Optical, PA and PE images from tumor invasion of mouse R2 on day 16. Photographs (6×6 mm) of window chamber’s (a) skin side and (b) coverslip side. (c) Series of superimposed PA (hot, λ = 800 nm, 20 dB) and PE (gray, 35 dB) slices (XY planes, 6×12 mm) stepping in the depth direction (Δz between slices = 240 μm). (d) YZ slice center of tumor (8×1.25 mm); bracket denotes range of slices in (c). The arrows indicate the common ink mark. (Color online only.)
Figure 7
Figure 7
Optical and PE images from mouse R2 on day 23. Photographs (6×6 mm) of window chamber’s (a) skin side and (b) coverslip side. (c) Series of lateral PE slices (35 dB) stepping in the depth direction (Δz between slices = 480 μm). (d) YZ slice through same tumor (10×3 mm); bracket denotes range of slices in (c). The arrows indicate the common ink mark. (Color online only.)
Figure 8
Figure 8
Optical, PA, and PE images from the tumor invasion of mouse R2 on day 29. Photographs (6×6 mm) of window chamber’s (a) skin side and (b) coverslip side. (c) Series of superimposed PA (hot, λ = 800 nm, 25 dB) and PE (gray, 35 dB) slices (XY planes, 6×12 mm) stepping in the depth direction (Δz between slices = 240 μm). (d) YZ slice through the center of the tumor (12×3 mm); bracket denotes range of slices in (c). Primary sources of the PA signal were the hemorrhage visible from the skin-side photograph and the common ink mark, denoted in (d) by right arrows. Left arrow in (d) indicates tumor side-lobe. (Color online only.)
Figure 9
Figure 9
Optical and PA tumor progression for mouse R2. (left) Photoacoustic maximum intensity projection (λ = 800 nm, 6×12 mm). Photographs (6×6 mm) of window chamber’s skin side (top right) and coverslip side (bottom right). PA images on days 9 and 16 revealed a map and progression of the vascular network. The PA signal for day 29 is largely dominated by the extensive hemorrhage, which is consistent with the skin side photograph. On day 16, several blood vessels were resolved using photoacoustics (labeled with small arrows), but not visualized in the skin side photograph. The large arrows denote the fiducial ink mark. (Color online only.)
Figure 10
Figure 10
(left) Tumor size and growth for three mice based on fluorescent GFP segmentation algorithm. Tumor cells were implanted on day 0. Average growth rates for the mice (R0, R1, R2), determined by the slope of the best fit line, were 0.52, 2.02, and 0.75 mm2∕day. (right) Time serial fluorescent images of GFP in mouse R2’s tumor spanning a 5×5 mm region of interest.
Figure 11
Figure 11
(left) Volumetric tissue growth for all three mice based on the PE segmentation algorithm. No data point was available for mouse R1 on day 29, because the mouse died prematurely. Day 0 corresponds to the day tumor cells were implanted. Average growth rates for the mice based on the slope of the best fit line were 5.35, 7.32, and 3.37 mm3∕day. (right) Time serial PE (gray, 35 dB) depth images at the approximate center of mouse R2’s tumor (YZ planes), illustrating tumor growth and proliferation. PE images were part of a 3-D data set.
Figure 12
Figure 12
Tumor growth determined from PE (solid lines) and fluorescent (dashed lines) segmentation algorithms. Measurements for each modality were normalized to their respective initial values. Correlation coefficients for each mouse between the pulse echo and fluorescent tumor size measurements are also indicated. A Fisher z-transform and bootstrapping algorithm indicated that the growth curves obtained by PE and fluorescent imaging were highly correlated and significant (Ravg = 0.97, p < 0.01).
Figure 13
Figure 13
Spectroscopic PA imaging of mouse R0 on day 29: (a) PA images (20 dB) labeled with incident laser wavelength, (b) PA image (hot, λ = 800 nm, 20 dB) superimposed on co-registered PE image (gray, 35 dB), and (c) Spectroscopic PA image with color (hot∕cold) representing the magnitude of the slope of the PA signal with laser wavelength. The magnitude of the slope has been compressed and displayed with a 30-dB dynamic range. Variation in blood oxygen saturation is a likely contributor to the different slopes. The PA slope at each pixel was determined from the best linear fit (see Fig. 14 for examples at regions A and B). All images have dimensions of 10×4.5 mm.
Figure 14
Figure 14
Magnitude of the PA signal versus laser wavelength for regions A and B from Fig. 13c. The slope of the best-fit line for region A (–0.032 dB∕nm) and B (0.042 dB∕nm) were consistent with the optical absorption spectrum of deoxygenated and oxygenated hemoglobin, respectively. However, there were other possible contributors to the wavelength dependence of the PA signal (see text).

References

    1. Meehan K. L., Holland J. W., and Dawkins H. J. S., “Proteomic analysis of normal and malignant prostate tissue to identify novel proteins lost in cancer,” Prostate 50(1), 54–63 (2002).10.1002/(ISSN)1097-0045 - DOI - PubMed
    1. Dennis L. K. and Resnick M. I., “Analysis of recent trends in prostate cancer incidence and mortality,” Prostate 42(4), 247–252 (2000).10.1002/(SICI)1097-0045(20000301) - DOI - PubMed
    1. Jemal A., Siegel R., Xu J., and Ward E., “Cancer statistics, 2010,” CA Cancer J. Clin. 60(5), 277 (2010).10.3322/caac.20073 - DOI - PubMed
    1. Kawachi M. H., Bahnson R. R., Barry M., Busby J. E., Carroll P. R., Carter H. B., Catalona W. J., Cookson M. S., Epstein J. I., Etzioni R. B., Giri V. N., Hemstreet G. P., Howe R. J., Lange P. H., Lilja H., Loughlin K. R., Mohler J., Moul J., Nadler R. B., Patterson S. G., Presti J. C., Stroup A. M., Wake R., and Wei J. T., “Prostate cancer early detection,” J. Natl. Comprehens. Cancer Netw. 8(2), 240–262 (2010). http://www.jnccn.org/content/8/2/240.short - PubMed
    1. Bauer D. R., Olafsson R., Montilla L. G. and Witte R. S., “In vivo multi-modality photoacoustic and pulse echo tracking of prostate tumor growth using a window chamber,” Proc. SPIE 7564, 75643B (2010).10.1117/12.843875 - DOI

Publication types