. 2011 Mar 1;2(2):e00271-10.
doi: 10.1128/mBio.00271-10. Print 2011.

Colonization-induced host-gut microbial metabolic interaction

Affiliations

Colonization-induced host-gut microbial metabolic interaction

Sandrine P Claus et al. mBio. .

Abstract

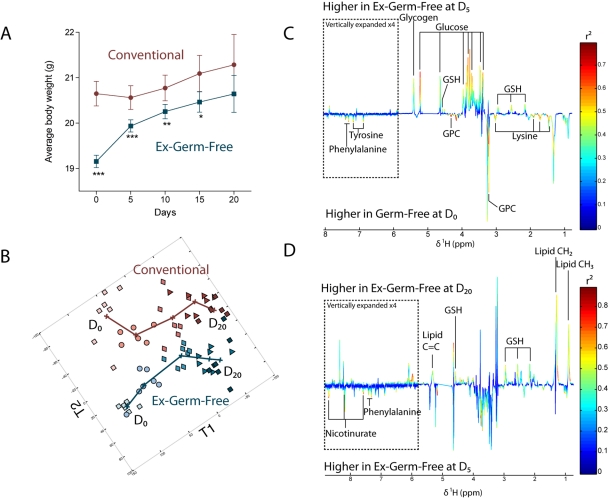
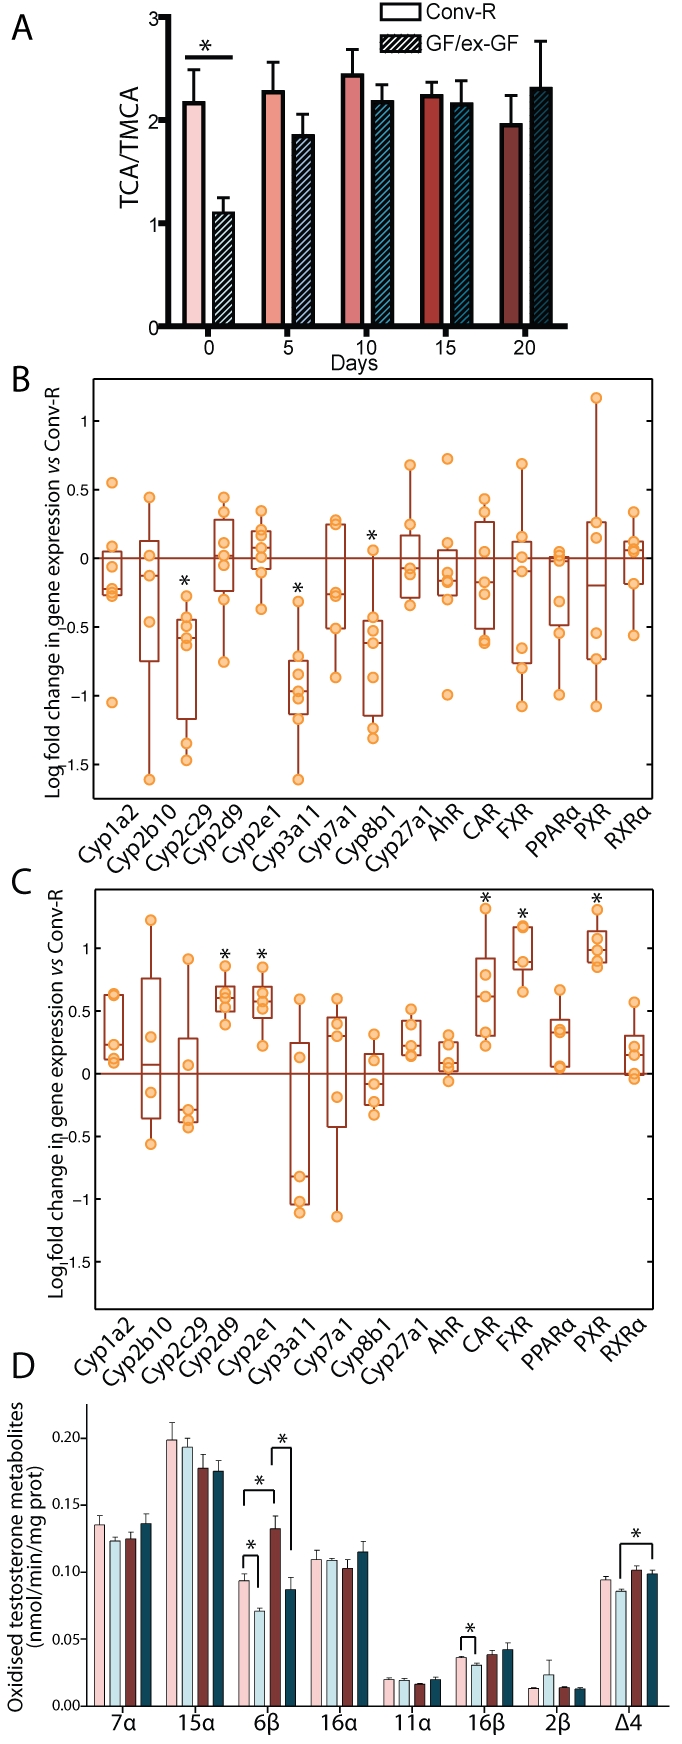
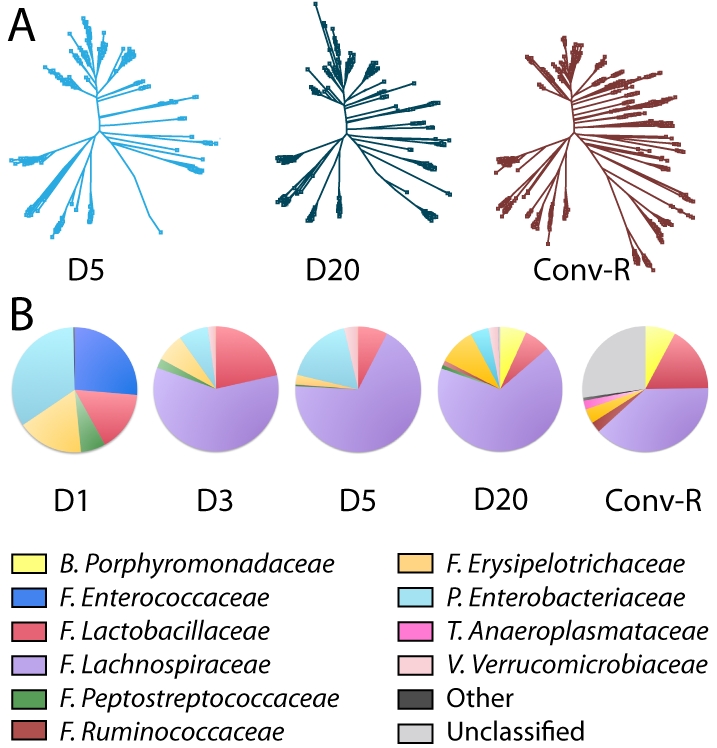
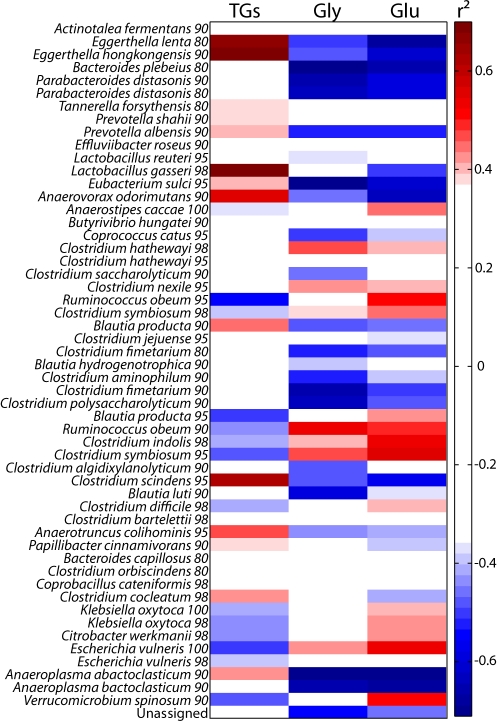
The gut microbiota enhances the host's metabolic capacity for processing nutrients and drugs and modulate the activities of multiple pathways in a variety of organ systems. We have probed the systemic metabolic adaptation to gut colonization for 20 days following exposure of axenic mice (n = 35) to a typical environmental microbial background using high-resolution (1)H nuclear magnetic resonance (NMR) spectroscopy to analyze urine, plasma, liver, kidney, and colon (5 time points) metabolic profiles. Acquisition of the gut microbiota was associated with rapid increase in body weight (4%) over the first 5 days of colonization with parallel changes in multiple pathways in all compartments analyzed. The colonization process stimulated glycogenesis in the liver prior to triggering increases in hepatic triglyceride synthesis. These changes were associated with modifications of hepatic Cyp8b1 expression and the subsequent alteration of bile acid metabolites, including taurocholate and tauromuricholate, which are essential regulators of lipid absorption. Expression and activity of major drug-metabolizing enzymes (Cyp3a11 and Cyp2c29) were also significantly stimulated. Remarkably, statistical modeling of the interactions between hepatic metabolic profiles and microbial composition analyzed by 16S rRNA gene pyrosequencing revealed strong associations of the Coriobacteriaceae family with both the hepatic triglyceride, glucose, and glycogen levels and the metabolism of xenobiotics. These data demonstrate the importance of microbial activity in metabolic phenotype development, indicating that microbiota manipulation is a useful tool for beneficially modulating xenobiotic metabolism and pharmacokinetics in personalized health care.

Importance: Gut bacteria have been associated with various essential biological functions in humans such as energy harvest and regulation of blood pressure. Furthermore, gut microbial colonization occurs after birth in parallel with other critical processes such as immune and cognitive development. Thus, it is essential to understand the bidirectional interaction between the host metabolism and its symbionts. Here, we describe the first evidence of an in vivo association between a family of bacteria and hepatic lipid metabolism. These results provide new insights into the fundamental mechanisms that regulate host-gut microbiota interactions and are thus of wide interest to microbiological, nutrition, metabolic, systems biology, and pharmaceutical research communities. This work will also contribute to developing novel strategies in the alteration of host-gut microbiota relationships which can in turn beneficially modulate the host metabolism.


Figures

FIG 1
FIG 1
Gut microbiota acquisition-induced weight gain is metabolically reflected at the hepatic level. (A) Average body weight along acclimatization in Conv-R (circles) and GF/ex-GF (squares) groups. ***, P < 0.001; **, P < 0.01; *, P < 0.05 (Student’s t test). Numbers of animals are unequal: n = 35 at D0, n = 28 at D5, n = 21 at D10, n = 14 at D15, and n = 7 at D20. (B) O-PLS scores derived from the model calculated from 600-MHz 1H NMR spectra of liver from Conv-R (pink or red symbols) and GF/ex-GF (blue symbols) mice at all time points using time and average weight as Y predictors (two predictive components plus 3 orthogonal components; Q2Y = 0.67, R2Y = 0.85, R2X = 0.46). Time points: D0 (light squares), D5 (circles), D10 (diamonds), D15 (triangles), and D20 (dark squares). (C) Coefficient plot related to the discrimination between GF animals at D0 (bottom) and ex-GF animals at D5 (top). (D) Coefficient plot related to the discrimination between ex-GF animals at D5 (bottom) and ex-GF animals at D20 (top). For panels C and D, metabolites are color coded according to their correlation coefficient, red indicating a very strong positive correlation (r2 > 0.7). The direction of the metabolite indicates the group with which it is positively associated as labeled on the diagram. GPC, glycerophosphocholine; GSH, glutathione.
FIG 2
FIG 2
Gut microbiota influences cytochrome P450 expression and activity in liver microsomes. (A) Relative quantification of TCA over TMCA in bile over the acclimatization process. (B) mRNA expression levels of CYPs and nuclear receptors in GF mouse microsomes at D0 expressed relative to those of Conv-R animals (orange line). (C) mRNA expression levels of selected CYPs and nuclear receptors in ex-GF mouse microsomes at D20 expressed relative to those of Conv-R animals (orange line). (D) Profile of oxidized metabolites of testosterone in liver microsomes after 30 min of incubation. Data are means ± standard errors of the means. Symbols: light pink bars, Conv-R animals at D0; light blue bars, GF animals at D0; dark red bars, Conv-R animals at D20; dark blue bars, ex-GF animals at D20. *, P < 0.05 (Student’s t test).
FIG 3
FIG 3
Gut microbiota establishment. (A) Phylogenetic trees illustrating the increasing complexity in gut microbiota in ex-GF animals at D5 and D20 and in Conv-R mice at D20. (B) The family-level composition of the gut microbiota in ex-GF animals at D1, D3, D5, and D20 and in Conv-R mice at D20. This analysis was computed using both V1-V2 and V4 regions. Abbreviations: B, Bacteroidetes; F, Firmicutes; P, Proteobacteria; T, Tenericutes; V, Verrucomicrobia.
FIG 4
FIG 4
Correlation heat map between bacteria classified in OTUs (using both V1-V2 and V4 regions) and hepatic energy metabolism. Each OTU is described by the best matching type strain and sequence identity cutoff (see Text S1 in the supplemental material for details). TGs, triglycerides.

Similar articles

Cited by

References

    1. Dethlefsen L., McFall-Ngai M., Relman D. A. 2007. An ecological and evolutionary perspective on human-microbe mutualism and disease. Nature 449:811–818 - PMC - PubMed
    1. Ley R. E., Turnbaugh P. J., Klein S., Gordon J. I. 2006. Microbial ecology: human gut microbes associated with obesity. Nature 444:1022–1023 - PubMed
    1. Dubos R., Schaedler R. W., Costello R., Hoet P. 1965. Indigenous, normal, and autochthonous flora of the gastrointestinal tract. J. Exp. Med. 122:67–76 - PMC - PubMed
    1. Schaedler R. W., Dubos R., Costello R. 1965. Association of germfree mice with bacteria isolated from normal mice. J. Exp. Med. 122:77–82 - PMC - PubMed
    1. Nicholls A. W., Mortishire-Smith R. J., Nicholson J. K. 2003. NMR spectroscopic-based metabonomic studies of urinary metabolite variation in acclimatizing germ-free rats. Chem. Res. Toxicol. 16:1395–1404 - PubMed

Publication types

MeSH terms