. 2011 Mar 1;71(5):1858-70.
doi: 10.1158/0008-5472.CAN-10-3604.

Chromosomal instability confers intrinsic multidrug resistance

Affiliations

Chromosomal instability confers intrinsic multidrug resistance

Alvin J X Lee et al. Cancer Res. .

Abstract

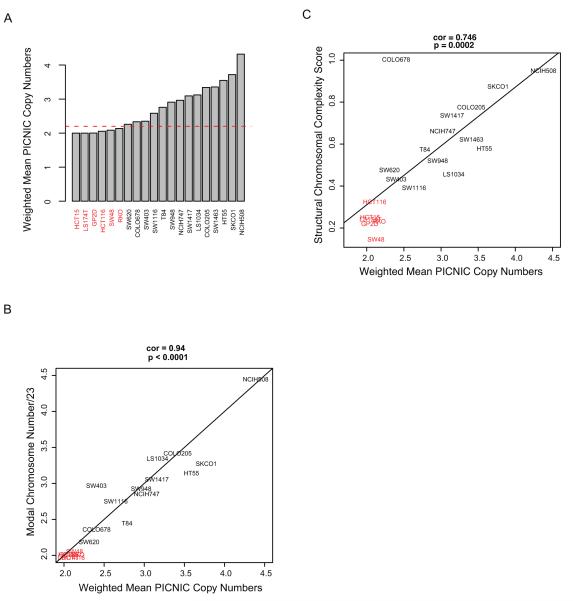
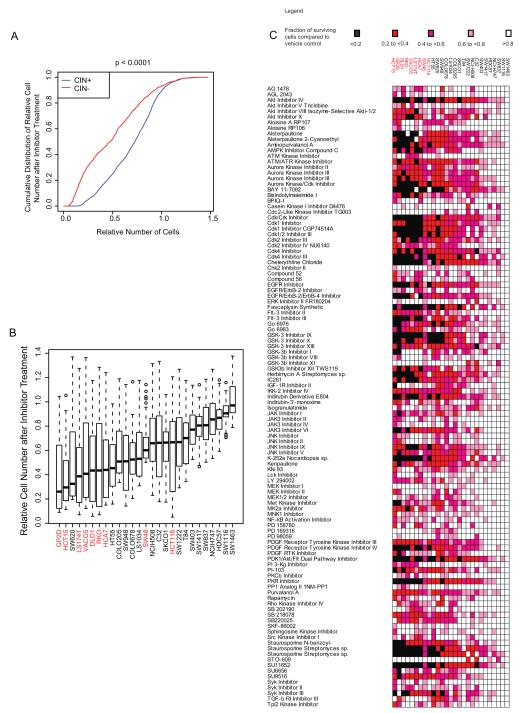
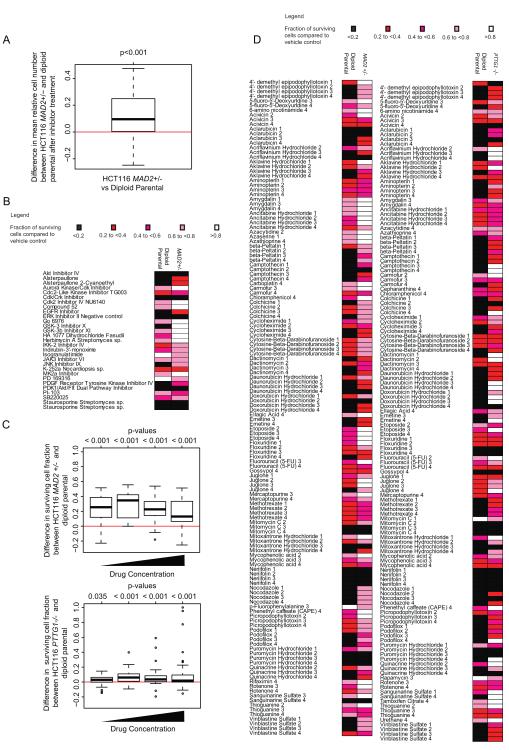
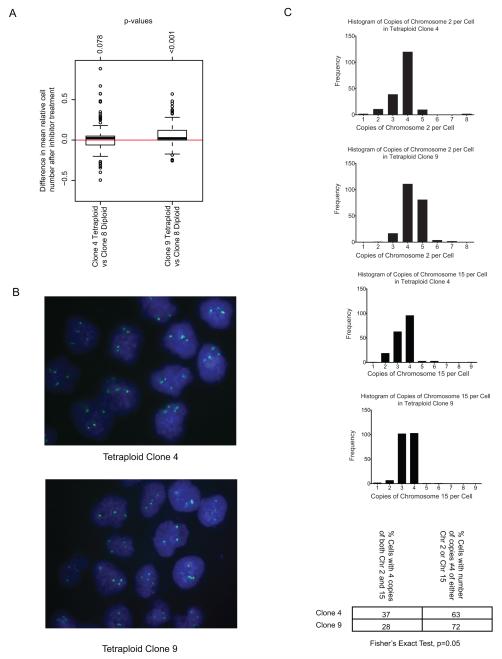
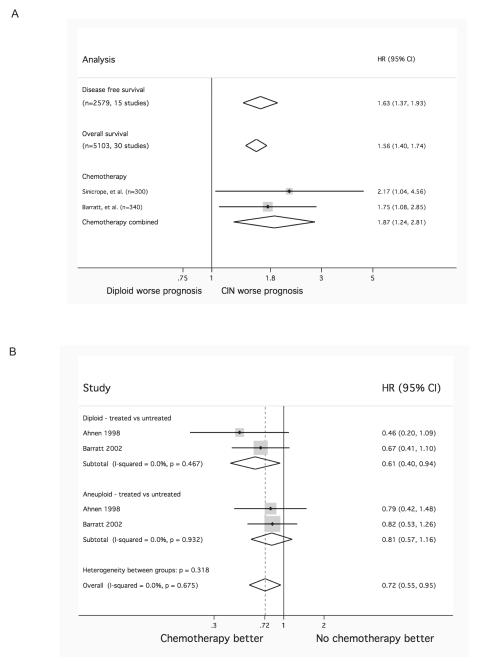
Aneuploidy is associated with poor prognosis in solid tumors. Spontaneous chromosome missegregation events in aneuploid cells promote chromosomal instability (CIN) that may contribute to the acquisition of multidrug resistance in vitro and heighten risk for tumor relapse in animal models. Identification of distinct therapeutic agents that target tumor karyotypic complexity has important clinical implications. To identify distinct therapeutic approaches to specifically limit the growth of CIN tumors, we focused on a panel of colorectal cancer (CRC) cell lines, previously classified as either chromosomally unstable (CIN(+)) or diploid/near-diploid (CIN(-)), and treated them individually with a library of kinase inhibitors targeting components of signal transduction, cell cycle, and transmembrane receptor signaling pathways. CIN(+) cell lines displayed significant intrinsic multidrug resistance compared with CIN(-) cancer cell lines, and this seemed to be independent of somatic mutation status and proliferation rate. Confirming the association of CIN rather than ploidy status with multidrug resistance, tetraploid isogenic cells that had arisen from diploid cell lines displayed lower drug sensitivity than their diploid parental cells only with increasing chromosomal heterogeneity and isogenic cell line models of CIN(+) displayed multidrug resistance relative to their CIN(-) parental cancer cell line derivatives. In a meta-analysis of CRC outcome following cytotoxic treatment, CIN(+) predicted worse progression-free or disease-free survival relative to patients with CIN(-) disease. Our results suggest that stratifying tumor responses according to CIN status should be considered within the context of clinical trials to minimize the confounding effects of tumor CIN status on drug sensitivity.


Figures

Figure 1
Figure 1
A) Barplot of the ploidy status of 20 CRC cell lines determined using mean copy number PICNIC analysis of SNP Array data. Red line indicates ploidy value threshold of 2.2. CIN+ cell lines in black text and CIN− cell lines in red text throughout. B) Correlation of modal chromosomal numbers and weighted mean copy numbers of the cell lines as determined by PICNIC. Pearson’s CC=0.94, p<0.0001. C) Correlation of Structural Chromosomal Complexity Score with ploidy as determined by weighted mean copy number PICNIC analysis of SNP Array data. Pearson’s CC=0.746, p=0.0002.
Figure 2
Figure 2
18 CIN+ and 9 CIN− CRC cell lines were treated with 160 kinase inhibitors at 10μM for 72 hours. A) A higher fraction of cells survive inhibitor treatment in CIN+ cell lines compared to CIN− cell lines. (p<0.0001). B) Boxplot of median cell number following inhibitor treatment across all inhibitors for all cell lines. The length of the whiskers was limited by maximal=1.5 times the IQR in this boxplot and throughout. C) Heatmap showing the relative numbers of surviving cells following inhibitor treatment across the cell lines (Inhibitors that have minimal impact on cell growth defined as a surviving cell fraction of >0.8 in >75% of the cell lines tested have been excluded).
Figure 3
Figure 3
A) Boxplot showing that following treatment with kinase inhibitors, there appeared to be a higher surviving fraction of cells in the HCT116 MAD2+/− cell line compared to its parental diploid cell line (p<0.001) following treatment with each equivalent inhibitor. B) Heatmap showing the relative numbers of surviving cells following the inhibitor treatments compared to vehicle control across the HCT116 MAD2+/− and parental diploid cell lines (Inhibitors that show a surviving cell fraction of >0.8 in both cell lines have been excluded). C) Biolog M11-M14 drug microplates were used at 4 increasing concentrations per drug (0.1μM to 25μM) to treat HCT116 MAD2+/− and PTTG1 −/− and their parental diploid cell lines for 72 hours. The boxplot shows difference in relative surviving cell number across all drugs at each of the four concentrations, comparing MAD2+/− and PTTG1 −/− cells to their specific isogenic parental cells. Significant p-values suggest higher resistance in MAD2+/− or PTTG1−/− cells compared to their parental diploid cells D) Heatmap of surviving fraction of cells compared to negative control in HCT116 MAD2+/−, PTTG1 −/− and their parental diploid cell lines treated with Biolog drug microplates. Drugs resulting in a surviving cellular fraction of >0.8 compared to negative control in both isogenic cell lines were excluded.
Figure 4
Figure 4
A) Boxplot of relative surviving cell numbers comparing HCT116 Tetraploid Clone 4 (TC4) and Diploid Clone 8 (DC8) cell lines, and Tetraploid Clone 9 (TC9) with DC8 cell lines. The TC9 cell line was significantly more resistant compared to DC8 (p<0.001). The difference in drug sensitivity between TC4 and DC8 was not significant (p=0.078). B) Representative FISH images for TC4 and TC9. Probes against Chromosome 15 in green. C) Histogram showing distribution of number of markers per cell corresponding to Chromosome 2 (top two) and 15 (bottom two) in TC4 and TC9. TC9 had a statistically significant higher proportion of cells that deviated from having 4 copies of both Chromosome 2 and 15 (p=0.05) compared to TC4.
Figure 5
Figure 5
A) Impact of CIN+ on disease free survival, overall survival, and those receiving adjuvant chemotherapy in loco-regional CRC. Overall CIN+ appears to confer a worse prognosis compared to diploid. B) Benefit derived from adjuvant 5-FU in patients with (near) diploid (top) and CIN+ (middle) CRC. Patients with diploid CRC appear to benefit more from chemotherapy compared to patients with CIN+ tumours. Combined analysis of CIN+ and diploid patients shows similar magnitude of benefit as would be expected from literature (bottom) (49).

References

    1. Lengauer C, Kinzler KW, Vogelstein B. Genetic instabilities in human cancers. Nature. 1998;396:643–9. - PubMed
    1. Lengauer C, Kinzler KW, Vogelstein B. Genetic instability in colorectal cancers. Nature. 1997;386:623–7. - PubMed
    1. Roschke AV, Tonon G, Gehlhaus KS, et al. Karyotypic complexity of the NCI-60 drug-screening panel. Cancer Res. 2003;63:8634–47. - PubMed
    1. Lothe RA, Peltomaki P, Meling GI, et al. Genomic instability in colorectal cancer: relationship to clinicopathological variables and family history. Cancer Res. 1993;53:5849–52. - PubMed
    1. Thibodeau SN, French AJ, Cunningham JM, et al. Microsatellite instability in colorectal cancer: different mutator phenotypes and the principal involvement of hMLH1. Cancer Res. 1998;58:1713–8. - PubMed

Publication types

MeSH terms