. 2011 Apr;121(4):1349-60.
doi: 10.1172/JCI44855.

Exploiting the mitochondrial unfolded protein response for cancer therapy in mice and human cells

Affiliations

Exploiting the mitochondrial unfolded protein response for cancer therapy in mice and human cells

Markus D Siegelin et al. J Clin Invest. 2011 Apr.

Abstract

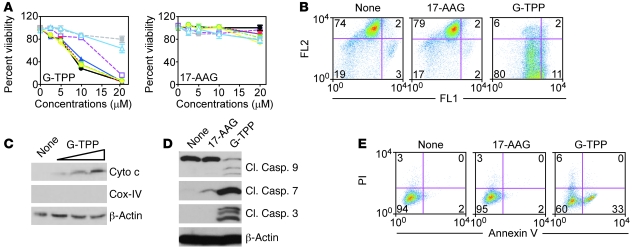
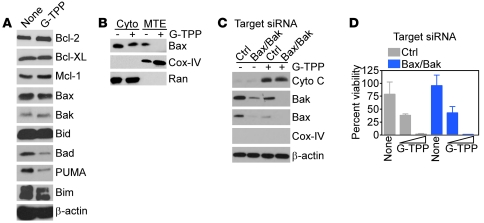
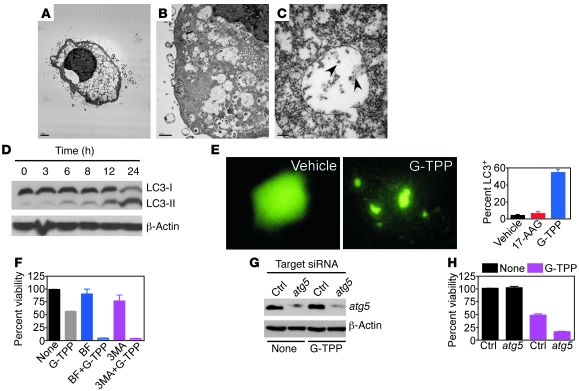
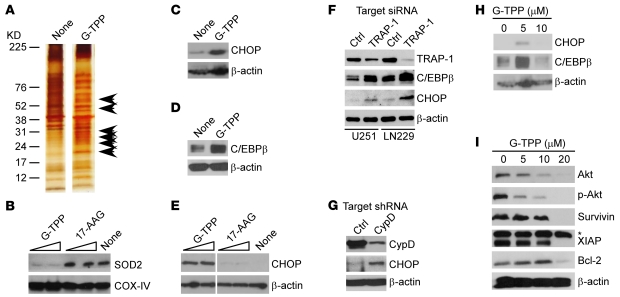
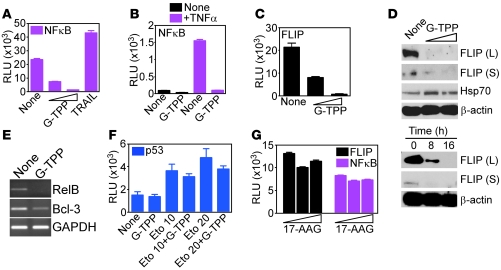
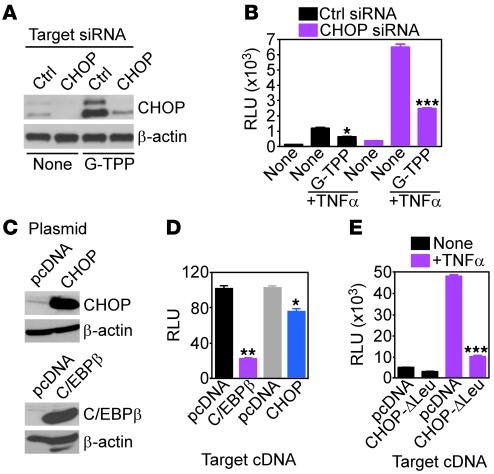
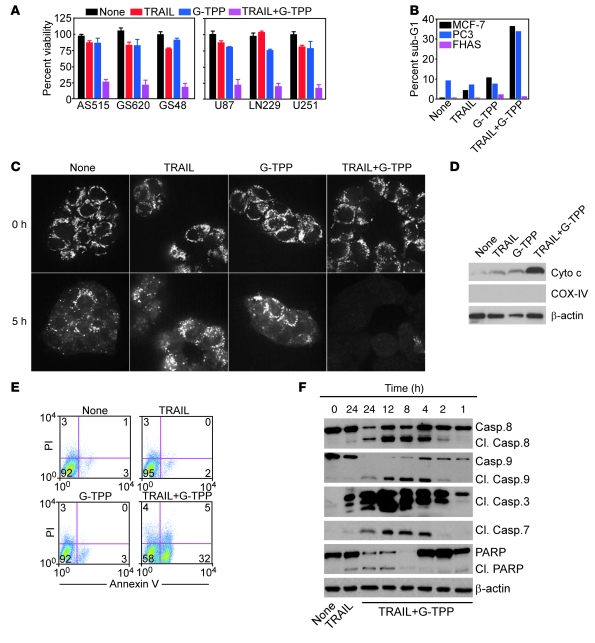
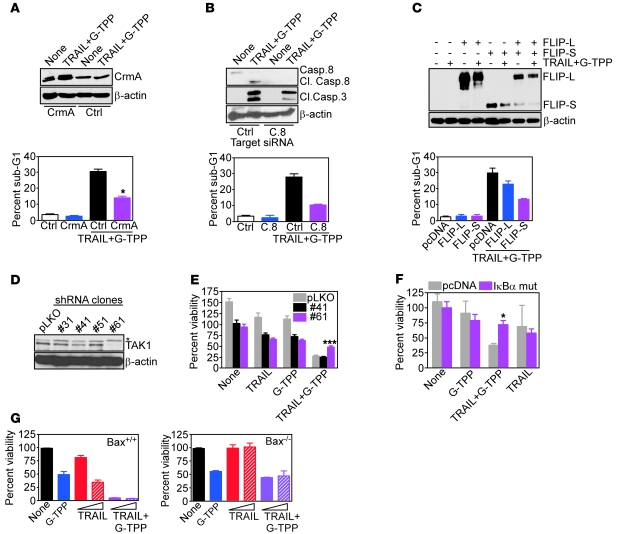
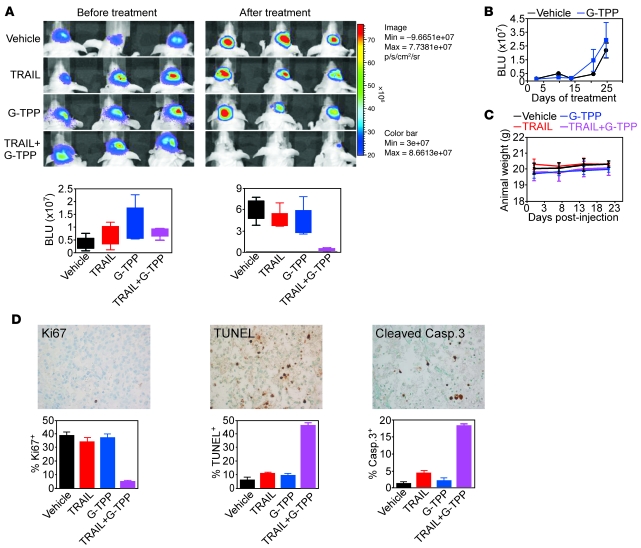
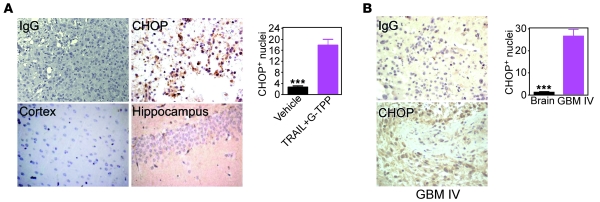
Fine tuning of the protein folding environment in subcellular organelles, such as mitochondria, is important for adaptive homeostasis and may participate in human diseases, but the regulators of this process are still largely elusive. Here, we have shown that selective targeting of heat shock protein-90 (Hsp90) chaperones in mitochondria of human tumor cells triggered compensatory autophagy and an organelle unfolded protein response (UPR) centered on upregulation of CCAAT enhancer binding protein (C/EBP) transcription factors. In turn, this transcriptional UPR repressed NF-κB-dependent gene expression, enhanced tumor cell apoptosis initiated by death receptor ligation, and inhibited intracranial glioblastoma growth in mice without detectable toxicity. These data reveal what we believe to be a novel role of Hsp90 chaperones in the regulation of the protein-folding environment in mitochondria of tumor cells. Disabling this general adaptive pathway could potentially be used in treatment of genetically heterogeneous human tumors.


Figures

Figure 1
Figure 1. “Mitochondriotoxic” activity of G-TPP.
(A) Cultured glioblastoma cell lines (U87, purple; LN229, blue; U251, black), patient-derived glioblastoma cells (GS620, yellow; GS48, green; AS515, red), or naive (gray), or SV40-transformed (light blue) normal FHAS were incubated with GamitrinibTPP (G-TPP, top) or 17-AAG (bottom) and analyzed for cell viability by MTT. Mean ± SD of replicates. (B) U87 cells were treated with G-TPP or 17-AAG and analyzed for mitochondrial membrane potential by JC-1 staining and flow cytometry. FL1, green fluorescence channel; FL2, red fluorescence channel. (C and D) U87 cells were incubated with 0–20 μM G-TPP (C) or 20 μM G-TPP or 17-AAG (D) and analyzed by immunoblotting. Cyto c, cytochrome c; Casp., caspase; Cl., cleaved. COX-IV was used as a mitochondrial marker. (E) U251 cells were treated as indicated and analyzed for annexin V/PI staining by flow cytometry. None, untreated. For B and E, the percentage of cells in each quadrant is indicated.
Figure 2
Figure 2. G-TPP–mediated mitochondrial dysfunction is independent of Bcl-2 proteins.
(A) U87 cells were incubated with 0–10 μM G-TPP for 16 hours and analyzed by immunoblotting. (B) LN229 cells were treated with or without G-TPP and cytosol (Cyto) or mitochondrial extracts (MTE) and were analyzed after 6 hours by immunoblotting. (C) LN229 cells were transfected with control (Ctrl) or Bax- and Bak-directed siRNA, treated with G-TPP, and analyzed after 16 hours by immunoblotting. (D) The experimental conditions are as in C, except that control or Bax/Bak knockdown cells were analyzed for cell viability by MTT. Mean ± SD of replicates.
Figure 3
Figure 3. Mitochondrial Hsp90 regulates autophagy.
(AC) LN229 cells were treated with G-TPP and analyzed by EM (A and B) or immunoelectron microscopy with an antibody to COX-IV (C). Arrowheads, COX-IV–reactive material. Scale bars: 2 μm (A); 1 μm (B); 200 nm (C). (D) U87 cells were treated with G-TPP, harvested at the indicated time intervals, and analyzed by immunoblotting. The position of the unmodified (I) or lipidated (II) form of LC3 is indicated. (E) U251 cells were transfected with LC3-GFP, treated with vehicle or G-TPP, and analyzed after 16 hours by fluorescence microscopy (left). The percentage of cells with punctate GFP fluorescence was quantified (right). Mean ± SD of 4–6 independent microscopy fields. (F) U87 cells were incubated with inhibitors of phagosome formation, bafilomycin A (BF), or 3-methyladenine (3-MA) for 1 hour, treated with G-TPP, and analyzed after 16 hours by MTT. Mean ± SD of replicates. (G) L229 cells were transfected with control or atg5-directed siRNA and analyzed by immunoblotting. (H) siRNA-transfected LN229 cells as in G were analyzed for cell viability after 16 hours by MTT. Mean ± SD of replicates.
Figure 4
Figure 4. Targeting mitochondrial Hsp90 induces organelle UPR.
(A) Detergent-insoluble mitochondrial proteins from control (none) or G-TPP–treated LN229 cells were visualized by silver staining. Arrowheads, insoluble, i.e., unfolded proteins. (BE) LN229 cells were treated as indicated and analyzed by immunoblotting. SOD2, mitochondrial superoxide dismutase. (F) The indicated glioblastoma cells were transfected with control or TRAP-1–directed siRNA and analyzed by immunoblotting. (G) LN229 cells were stably transfected with control or CypD-directed shRNA and analyzed by immunoblotting. (HI) LN229 cells were incubated with the indicated concentrations of G-TPP and analyzed by immunoblotting after 6 hours (H) or 16 hours (I). p-Akt, phosphorylated Akt; *Nonspecific.
Figure 5
Figure 5. Mitochondrial UPR suppresses NF-κB activity.
(AC) U251 cells were treated as indicated and analyzed for β-galactosidase–normalized NF-κB (A and B) or FLIP (C) luciferase promoter activity in a luminometer in the absence (A and C) or presence of TNF-α (B). TRAIL (800 ng/ml) was used as control. Mean ± SD of replicates. (D) G-TPP–treated LN229 cells were analyzed by immunoblotting. Top, dose-response; bottom, time-course. L, FLIP long form; S, FLIP short form. (E) G-TPP–treated LN229 cells were analyzed by PCR. (F) MCF-7 cells were treated as indicated and analyzed after 5 hours for β-galactosidase–normalized p53 luciferase promoter activity. (G) U251 cells were treated with nontargeted 17-AAG and analyzed after 8 hours for NF-κB or cFLIP luciferase promoter activity. Mean ± SEM of replicates of a representative experiment.
Figure 6
Figure 6. Mitochondrial UPR regulation of NF-κB activity.
(A) LN229 cells transfected with control or CHOP-directed siRNA were treated with G-TPP and analyzed by immunoblotting. (B) siRNA-transfected LN229 cells as in A were treated with G-TPP and analyzed for NF-κB luciferase promoter activity, with or without TNF-α. Mean ± SD of replicates. *P = 0.018; ***P = 0.0007. (C) LN229 cells were transfected with the indicated plasmids and analyzed by immunoblotting. (D) Transfected LN229 cells as in C were analyzed for NF-κB luciferase promoter activity in the presence of TNF-α. Mean ± SD of replicates. *P = 0.02; **P = 0.0021. (E) LN229 cells transfected with pcDNA or a CHOP mutant lacking the leucine zipper (CHOP-ΔLeu) were analyzed for NF-κB luciferase promoter activity with or without TNF-α. Mean ± SD of replicates. ***P = 0.0006.
Figure 7
Figure 7. Exploitation of mitochondrial UPR for combination anticancer therapy.
(A) Patient-derived (left) or cultured (right) glioblastoma cells were treated with TRAIL or G-TPP, alone or in combination, and analyzed by MTT. Mean ± SD of replicates. (B) The indicated cell types were treated as in A and analyzed for DNA content by PI staining and flow cytometry. The percentage of cells with hypodiploid (sub-G1) DNA content is indicated. Representative experiment. (C) U251 cells were labeled with TMRM, treated as indicated, and analyzed for loss of mitochondrial membrane potential after 0 or 5 hours by confocal laser microscopy. Representative experiment. Original magnification, ×600. (D) U251 cells treated as indicated were analyzed after 16 hours by immunoblotting. (E) Treated U251 cells were analyzed after 16 hours for annexin V/PI staining by flow cytometry. The percentage of cells in each quadrant is indicated. (F) Treated U87 cells were analyzed after the indicated time intervals by immunoblotting. Cl, cleaved.
Figure 8
Figure 8. TRAIL plus Gamitrinib anticancer activity.
(AC) LN229 cells were transfected with control, CrmA (A), caspase-8 (C.8) (B), or FLIP (C) cDNA, treated with the combination of TRAIL plus G-TPP, and analyzed after 16 hours by immunoblotting (top), or PI staining and flow cytometry (bottom). The percentage of cells with hypodiploid (sub-G1) DNA content is indicated. Mean ± SEM of replicates. *P = 0.011–0.032; (D and E) MCF-7 cells were stably transfected with control lentivirus (pLKO) or lentivirus encoding TAK-1–directed shRNA, and stable clones (#) were analyzed by immunoblotting (D) or cell viability by MTT (E). *Nonspecific. Mean ± SEM of replicates. ***P < 0.0001. (F) LN229 cells were transfected with control or IκBα “super-repressor” mutant cDNA, treated as indicated, and analyzed for cell viability by MTT. Mean ± SEM of replicates. *P = 0.01. (G) Bax+/+ (left) or Bax–/– (right) HCT116 cells were treated as indicated and analyzed for cell viability by MTT. Mean ± SEM of replicates.
Figure 9
Figure 9. Exploitation of mitochondrial UPR for antiglioma therapy in vivo.
(A) Nude mice carrying intracranial U87-Luc glioblastomas were treated as indicated and analyzed by bioluminescence imaging (top). Bottom, quantification of bioluminescence signals before or after treatment. The statistical analysis of animal survival in the various groups at the end of the experiment is as follows: vehicle versus G-TPP, NS; vehicle versus TRAIL, NS; TRAIL (27 days) versus TRAIL+G-TPP (35 days), P = 0.0044; G-TPP (25 days) versus TRAIL+G-TPP (35 days), P = 0.0017; vehicle (24 days) versus TRAIL+G-TPP (35 days), P = 0.0014. (B) Nude mice carrying established intracranial glioblastomas as in A were treated with vehicle or G-TPP monotherapy at 20 mg/kg as daily i.p. injections and analyzed by bioluminescence imaging. Mean ± SEM of groups with mice as the individual units. P = 0.67. (C) Nude mice as in A were monitored for weight changes during the various treatments. Mean ± SD of individual groups. (D) Brain sections from TRAIL+G-TPP–treated mice were analyzed for cell proliferation (Ki67), internucleosomal DNA fragmentation (TUNEL), or active caspase-3 (top) by immunohistochemistry, and the percentage of positive cells was quantified (bottom). Original magnification, ×400.
Figure 10
Figure 10. Activation of a mitochondrial UPR in cancer in vivo.
(A) Brain sections from TRAIL+G-TPP–treated mice were stained with IgG or an antibody to CHOP (left), and immunoreactive nuclei were quantified (right). (B) Representative cases of WHO grade IV human glioblastoma or adjacent normal brain were stained with IgG or an antibody to CHOP (left), and immunoreactive nuclei were quantified (right). Mean ± SEM. ***P < 0.0001. Original magnification, ×400.

References

    1. Butow RA, Avadhani NG. Mitochondrial signaling: the retrograde response. Mol Cell. 2004;14(1):1–15. doi: 10.1016/S1097-2765(04)00179-0. - DOI - PubMed
    1. Ron D, Walter P. Signal integration in the endoplasmic reticulum unfolded protein response. Nat Rev Mol Cell Biol. 2007;8(7):519–529. doi: 10.1038/nrm2199. - DOI - PubMed
    1. Ma Y, Hendershot LM. The role of the unfolded protein response in tumour development: friend or foe? Nat Rev Cancer. 2004;4(12):966–977. doi: 10.1038/nrc1505. - DOI - PubMed
    1. Kaufman RJ. Orchestrating the unfolded protein response in health and disease. J Clin Invest. 2002;110(10):1389–1398. - PMC - PubMed
    1. Amuthan G, Biswas G, Zhang SY, Klein-Szanto A, Vijayasarathy C, Avadhani NG. Mitochondria-to-nucleus stress signaling induces phenotypic changes, tumor progression and cell invasion. EMBO J. 2001;20(8):1910–1920. doi: 10.1093/emboj/20.8.1910. - DOI - PMC - PubMed

Publication types

MeSH terms