

The effect of study design biases on the diagnostic accuracy of magnetic resonance imaging for detecting silicone breast implant ruptures: a meta-analysis
- PMID: 21364405
- PMCID: PMC3080104
- DOI: 10.1097/PRS.0b013e3182043630
The effect of study design biases on the diagnostic accuracy of magnetic resonance imaging for detecting silicone breast implant ruptures: a meta-analysis
Abstract
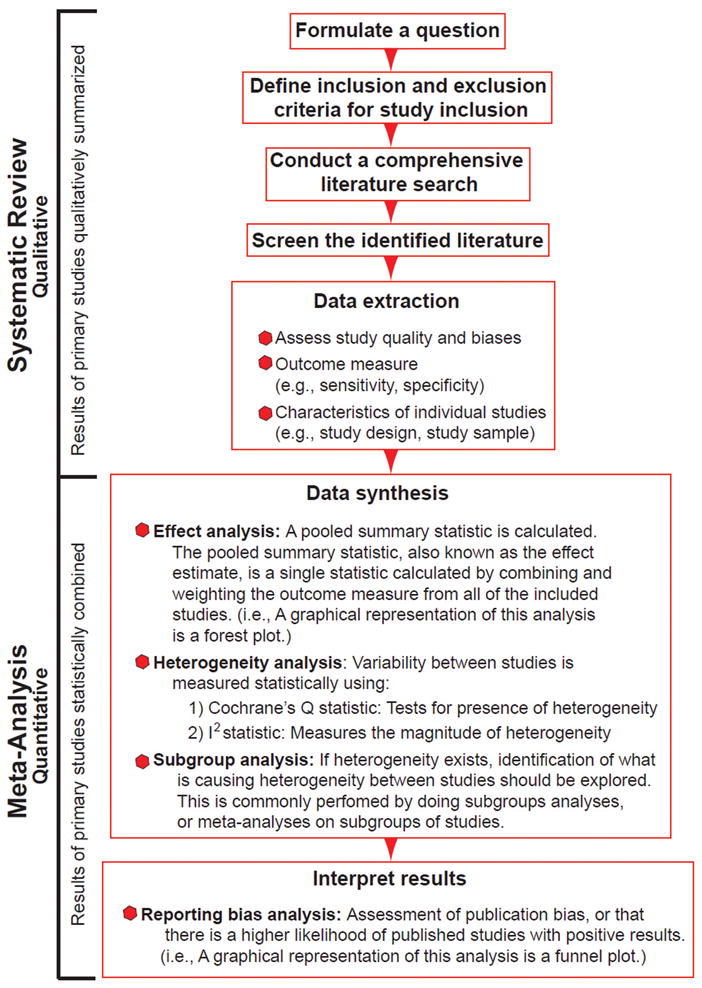
Background: The U.S. Food and Drug Administration has recommended that all silicone breast implant recipients undergo serial screening to detect implant rupture with magnetic resonance imaging. The authors performed a systematic review and meta-analysis to examine the effect of study design biases on the estimation of magnetic resonance imaging diagnostic accuracy measures.
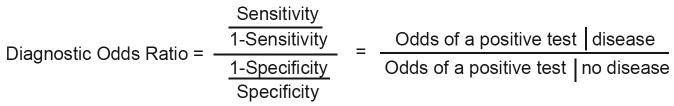
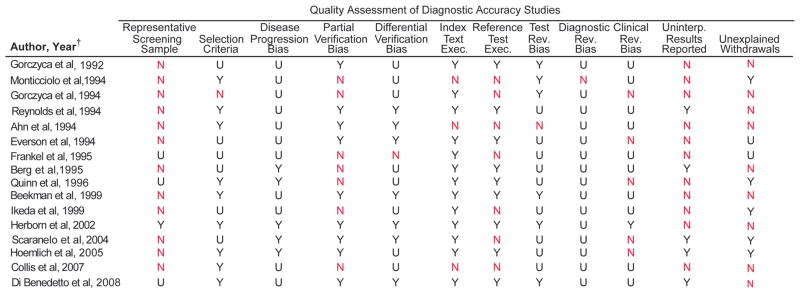
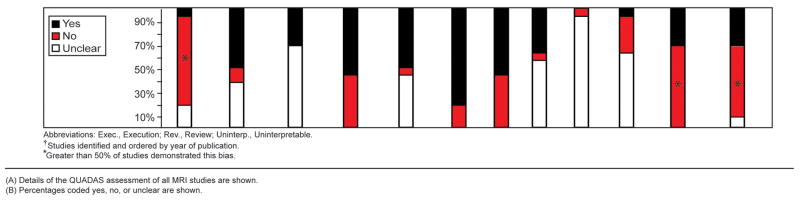
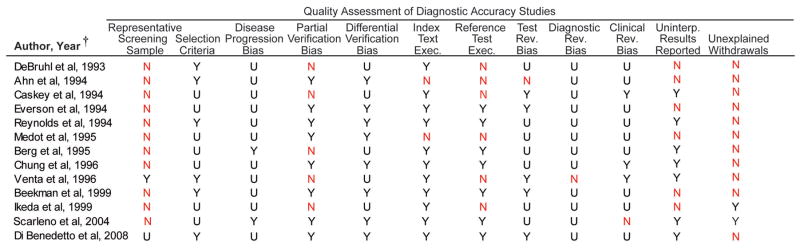
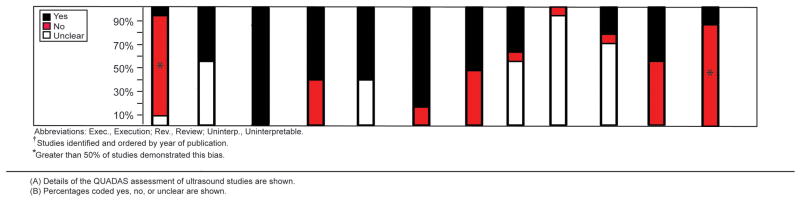
Methods: Studies were identified using the MEDLINE, EMBASE, ISI Web of Science, and Cochrane library databases. Two reviewers independently screened potential studies for inclusion and extracted data. Study design biases were assessed using the Quality of Diagnostic Accuracy Studies tool and the Standards for Reporting of Diagnostic Accuracy Studies checklist. Meta-analyses estimated the influence of biases on diagnostic odds ratios.
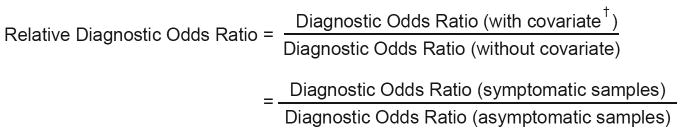
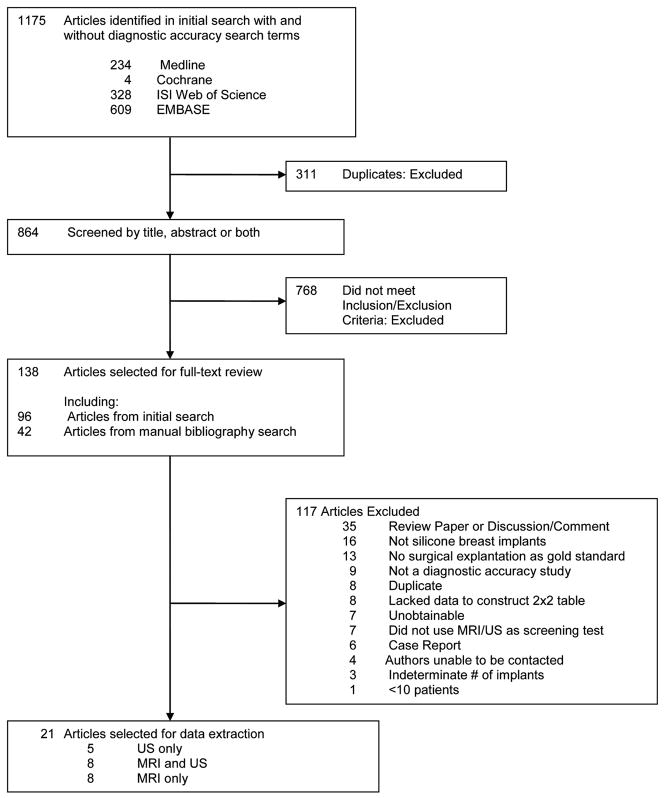
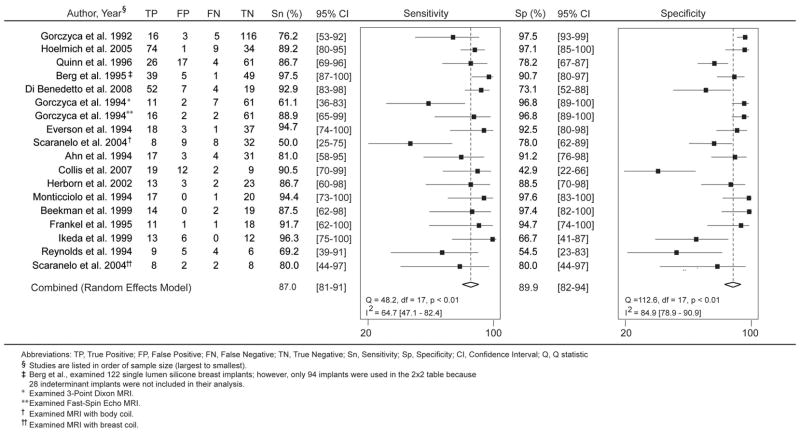
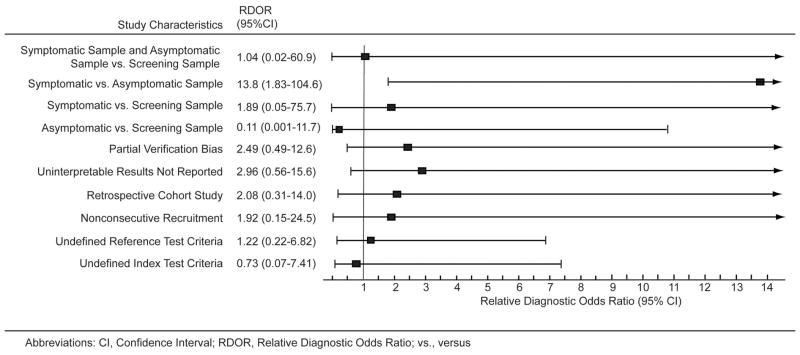
Results: Among 1175 identified articles, 21 met the inclusion criteria. Most studies using magnetic resonance imaging (10 of 16) and ultrasound (10 of 13) examined symptomatic subjects. Magnetic resonance imaging studies evaluating symptomatic subjects had 14-fold higher diagnostic accuracy estimates compared with studies using an asymptomatic sample (relative diagnostic odds ratio, 13.8; 95 percent confidence interval, 1.83 to 104.6) and 2-fold higher diagnostic accuracy estimates compared with studies using a screening sample (relative diagnostic odds ratio, 1.89; 95 percent confidence interval, 0.05 to 75.7).
Conclusions: Many of the published studies using magnetic resonance imaging or ultrasound to detect silicone breast implant rupture are flawed with methodologic biases. These methodologic shortcomings may result in overestimated magnetic resonance imaging diagnostic accuracy measures and should be interpreted with caution when applying the data to a screening population.
Conflict of interest statement
Figures
Comment in
-
Discussion. The effect of study design biases on the diagnostic accuracy of magnetic resonance imaging for detecting silicone breast implant ruptures: a meta-analysis.Plast Reconstr Surg. 2011 Mar;127(3):1045-1046. doi: 10.1097/PRS.0b013e31820c3159. Plast Reconstr Surg. 2011. PMID: 21364406 No abstract available.
References
-
- Spiera H. Scleroderma after silicone augmentation mammoplasty. JAMA. 1988;260:236–8. - PubMed
-
- Silverstein MJ, Gierson ED, Gamagami P, et al. Breast cancer diagnosis and prognosis in women augmented with silicone gel-filled implants. Cancer. 1990;66:97–101. - PubMed
-
- Sanger JR, Matloub HS, Yousif NJ, et al. Silicone gel infiltration of a peripheral nerve and constrictive neuropathy following rupture of a breast prosthesis. Plast Reconstr Surg. 1992;89:949–952. - PubMed
-
- Hilts PJ. FDA restricts use of implants pending studies. New York Times Online; [Accessed May 10, 2010]. Available at: http://www.nytimes.com/1992/01/07/science/fda-seeks-halt-in-breast-impla....
-
- McLaughlin JK, Lipworth L, Murphy DK, et al. The safety of silicone gel-filled breast implants: A review of the epidemiologic evidence. Ann Plast Surg. 2007;59:569–580. - PubMed
Publication types
MeSH terms
Substances
Grants and funding
LinkOut - more resources
Full Text Sources
Medical
Miscellaneous
