. 2011 Apr 6;30(7):1209-20.
doi: 10.1038/emboj.2011.53. Epub 2011 Mar 1.

Ca2+ induces clustering of membrane proteins in the plasma membrane via electrostatic interactions

Affiliations

Ca2+ induces clustering of membrane proteins in the plasma membrane via electrostatic interactions

Felipe E Zilly et al. EMBO J. .

Abstract

Membrane proteins and membrane lipids are frequently organized in submicron-sized domains within cellular membranes. Factors thought to be responsible for domain formation include lipid-lipid interactions, lipid-protein interactions and protein-protein interactions. However, it is unclear whether the domain structure is regulated by other factors such as divalent cations. Here, we have examined in native plasma membranes and intact cells the role of the second messenger Ca(2+) in membrane protein organization. We find that Ca(2+) at low micromolar concentrations directly redistributes a structurally diverse array of membrane proteins via electrostatic effects. Redistribution results in a more clustered pattern, can be rapid and triggered by Ca(2+) influx through voltage-gated calcium channels and is reversible. In summary, the data demonstrate that the second messenger Ca(2+) strongly influences the organization of membrane proteins, thus adding a novel and unexpected factor that may control the domain structure of biological membranes.


Conflict of interest statement

The authors declare that they have no conflict of interest.

Figures

Figure 1
Figure 1
Rising intracellular Ca2+ dramatically diminishes membrane protein immunostaining intensities. (A, B) PC12 cells were treated for 5 min with 20 μM ionomycin in the absence or presence of extracellular Ca2+, followed by the generation of membrane sheets and immunostaining for a variety of structurally diverse membrane proteins. (A) (Upper panels) TMA-DPH staining for the visualization of phospholipid membranes, indicating location and integrity of the basal plasma membranes; (lower panels) immunostaining for transferrin receptor (left) or SNAP25 (right). (B) Quantification of Ca2+-dependent decreases in immunostaining intensity. Remaining fluorescence after Ca2+ treatment was normalized to the values obtained in the absence of Ca2+ and expressed as percentage. Values are means±s.e.m. (n=3 independent experiments; 31–78 membrane sheets were analysed for each condition in one experiment).
Figure 2
Figure 2
Ca2+ acts directly at the plasma membrane via electrostatic mechanisms. (AD) Freshly prepared membrane sheets were treated in the presence (A, B) or absence (C, D) of magnesium for 10 min at 37°C with a defined Ca2+ concentration, fixed, immunostained for membrane proteins as indicated (Syp, TfR and Syx1 refer to synaptophysin, transferrin receptor and syntaxin 1 respectively) and analysed as in Figure 1. (A) Magnified views from immunostained membrane sheets after treatments with no (upper panels) or 54 μM (lower panels) Ca2+. (BD) Change in immunostaining intensity induced by 54 μM (B), 850 nM (C) or 225 nM (D) Ca2+. Residual fluorescence intensities were normalized to the intensities obtained in the absence of Ca2+ and expressed as percentage. Values are means±s.e.m. (n=3–6 independent experiments; 18–106 membrane sheets were analysed for each condition in one experiment). (E) At pH 7.4, the amino acids Asp (D) and Glu (E) are negatively charged whereas Arg (R) and Lys (K) carry positive charges. For each membrane protein, the number of the negatively and positively charged amino acids within the cytoplasmic regions was determined and %DE–%RK plotted against fluorescence remaining after Ca2+ treatment with 850 nM (black) or 54 μM Ca2+ (grey).
Figure 3
Figure 3
Decrease in immunostaining intensity correlates with redistribution of membrane proteins into more clustered patterns. (A, D) Syntaxin (A) and SNAP25 (D) stainings on membrane sheets incubated with 54 μM Ca2+ for times as indicated. (Upper panels) Images at the same scaling, illustrating that staining becomes dimmer over time. (Lower panels) In order to illustrate that dimming correlates with a higher degree of protein clustering images were background subtracted, and mean intensity normalized to the mean intensity of the image from the directly fixed membrane sheet. Presenting images at the same scaling illustrates that the available signal becomes more punctate upon Ca2+ treatment. For syntaxin (B, C) and SNAP25 (E, F) mean staining intensity (B, E) and pixel s.d. of the mean (normalized to mean background subtracted intensity, related to the 0 s value) (C, F) were plotted against incubation time without Ca2+ (green traces) or with 54 μM Ca2+ (red traces). Values are means±s.e.m. (n=3 independent experiments; 26–74 membrane sheets were analysed for each condition in one experiment).
Figure 4
Figure 4
Membrane protein mobility measured by FRAP reveals that Ca2+ increases the fraction of immobile membrane proteins and the diffusion rate of the mobile fraction. (A, B) Fluorescence recovery after photobleaching (FRAP) experiments on PC12 cells expressing syntaxin 1A-GFP (A) or GFP-SNAP25 (B). Fluorescence in the basal plasma membrane was bleached in a squared region of interest (ROI; indicated by the white boxes) and fluorescence recovery by membrane protein diffusion was monitored (upper panels in (A, B)). Then cells were treated for 5 min with the Ca2+ carrier ionomycin in the presence of extracellular Ca2+ and a second recovery curve was monitored (lower panels in (A, B)), showing that Ca2+ caused a diminishment in maximal recovery (for averaged data see (C, D); for quantification see Figure S6) and an acceleration of the diffusion rate (for quantification see Supplementary Figure S6 and (E)). In contrast, recovery traces were essentially unchanged when in control experiments in the second FRAP measurement extracellular Ca2+ was chelated by EGTA (data not shown). (C, D) Averaged recovery traces from three independent experiments for syntaxin (C) and SNAP25 (D). Green and red traces refer to the first FRAP experiment in low calcium Ringer solution and the second FRAP experiment in Ringer containing the Ca2+ carrier ionomycin, respectively. Values are given as mean±s.d. (n=3 individual traces; for one individual trace the recovery curves from 3 to 6 cells were averaged). For quantification of the effects, the hyperbola function formula image
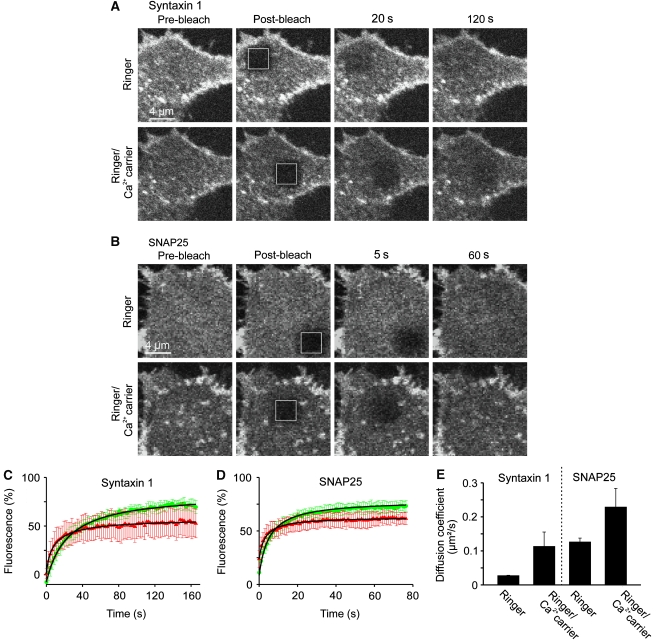
, which yields the maximal recovery (maxrec) and the half-time of recovery (t1/2), was fitted to the averaged traces obtained from one individual experiment. Before fitting, the traces were rescaled setting the pre-bleach and the post-bleach values to 100 and 0%, respectively. Averaged fits are shown in Supplementary Figure S6 and as black lines with adjusted scaling in (C, D) for comparison to averaged raw data. From the individual fits maximal recovery and half-time of recovery were further used for calculation of the immobile fraction (immobile fraction=100% − maximal recovery) and the apparent lateral diffusion coefficient. The size of the immobile pools increased after rising Ca2+ from 15 to 43% for syntaxin and from 23 to 49% for SNAP25. Values are given as mean±s.e.m. (n=3). (E) Ca2+-induced change of the apparent lateral diffusion coefficient. Values are given as mean±s.e.m. (n=3).
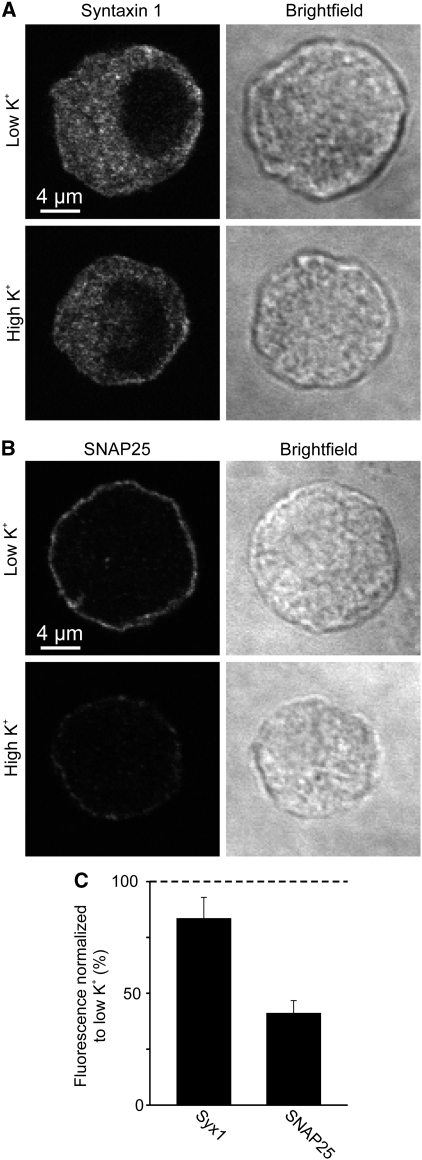
Figure 5
Figure 5
Membrane protein redistribution after depolarization-induced calcium channel opening. (A, B) Bovine chromaffin cells were treated for 30 s with low or high potassium Ringer solution at 37°C, fixed and immunostained for syntaxin (A) or SNAP25 (B). Confocal micrographs from equatorial sections in the immunofluorescence (left) and in the brightfield (right) channels are shown. Depolarization-induced decrease of plasmalemmal immunofluorescence was analysed by linescans placed at the periphery of the cell (for details see Materials and methods). (C) High potassium values were related to corresponding low potassium values (set to 100%). Values are means±s.e.m. (n=4 independent experiments).
Figure 6
Figure 6
Ca2+ inhibits SNARE reactivity. (A, B) Freshly prepared membrane sheets were incubated for 5 min with 10 μM Alexa594-labelled soluble synaptobrevin 2 in the presence of variable Ca2+ concentrations, washed, fixed and binding of synaptobrevin to membrane sheets was quantified by fluorescence microscopy. (A) (Left) TMA-DPH phospholipid staining visualizing the basal plasma membrane; (right) membrane-bound synaptobrevin. (B) For each Ca2+ concentration incorporated synaptobrevin was quantified and intensity was related to the value obtained in the absence of Ca2+ (set to 100%). Values are given as means±s.e.m. (n=4–5 experiments, 12–66 membrane sheets were analysed for one condition in one experiment). (C) Illustration of the biochemical reaction underlying synaptobrevin 2 binding to the plasma membrane. Synaptobrevin binding depends on both syntaxin 1 and SNAP25 (Lang et al, 2002), which form an acceptor complex (not shown for clarity) that in turn interacts with soluble synaptobrevin, resulting in a so-called cis-SNARE complex (right).

References

    1. Barnstable CJ, Hofstein R, Akagawa K (1985) A marker of early amacrine cell development in rat retina. Brain Res 352: 286–290 - PubMed
    1. Barszczewski M, Chua JJ, Stein A, Winter U, Heintzmann R, Zilly FE, Fasshauer D, Lang T, Jahn R (2008) A novel site of action for alpha-SNAP in the SNARE conformational cycle controlling membrane fusion. Mol Biol Cell 19: 776–784 - PMC - PubMed
    1. Bollmann JH, Sakmann B (2005) Control of synaptic strength, timing by the release-site Ca2+ signal. Nat Neurosci 8: 426–434 - PubMed
    1. Bolte S, Cordelieres FP (2006) A guided tour into subcellular colocalization analysis in light microscopy. J Microsc 224: 213–232 - PubMed
    1. Dupuy AD, Engelman DM (2008) Protein area occupancy at the center of the red blood cell membrane. Proc Natl Acad Sci USA 105: 2848–2852 - PMC - PubMed

Publication types