. 2010;1(2):e25.
doi: 10.1038/cddis.2010.6.

An automated fluorescence videomicroscopy assay for the detection of mitotic catastrophe

Affiliations

An automated fluorescence videomicroscopy assay for the detection of mitotic catastrophe

S Rello-Varona et al. Cell Death Dis. 2010.

Abstract

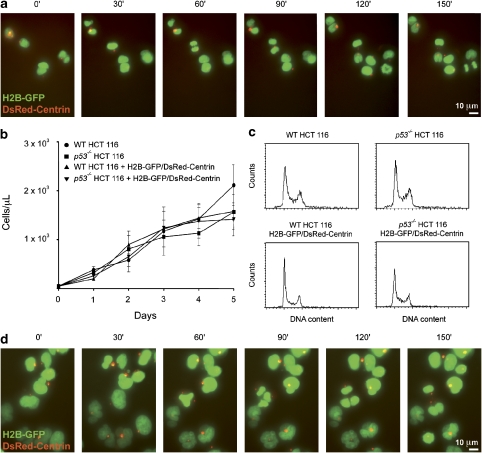
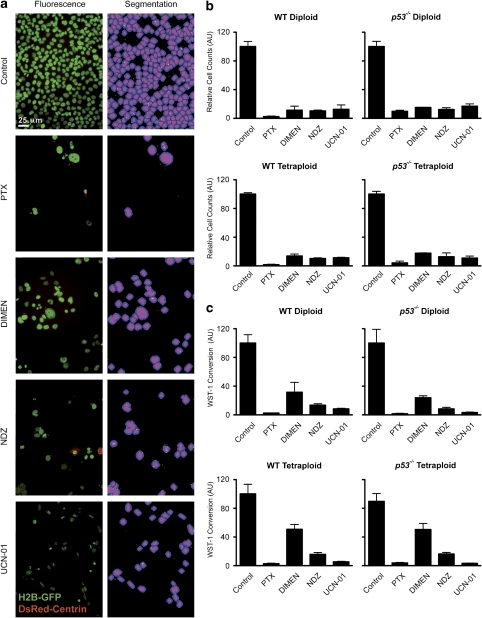
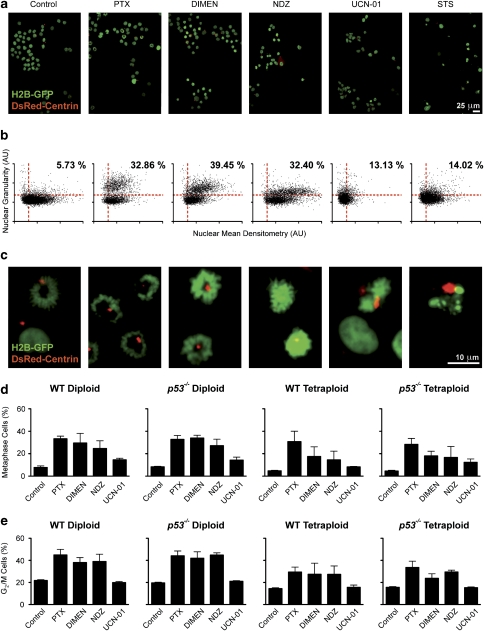
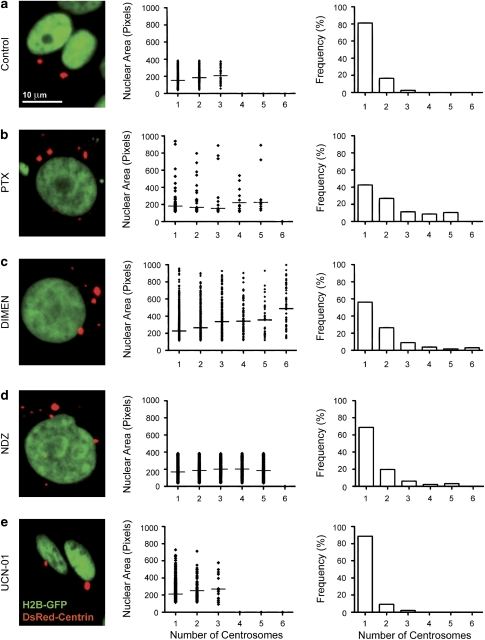
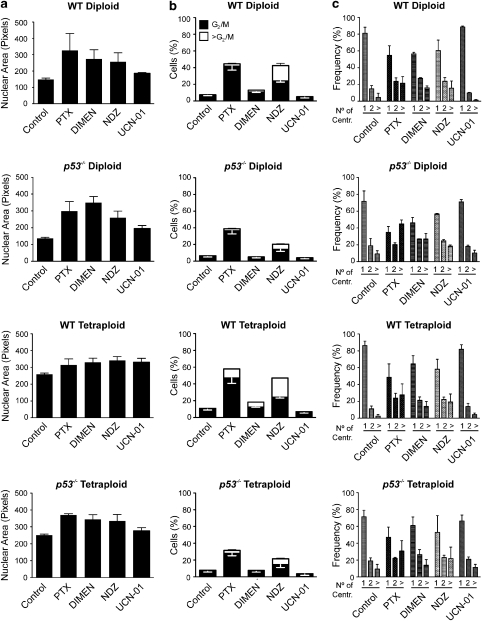
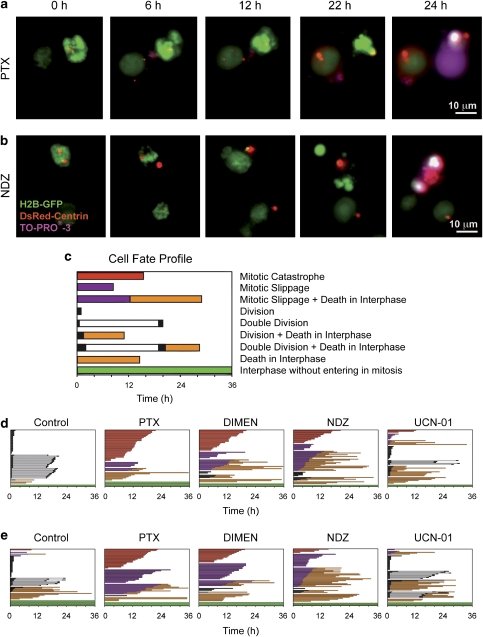
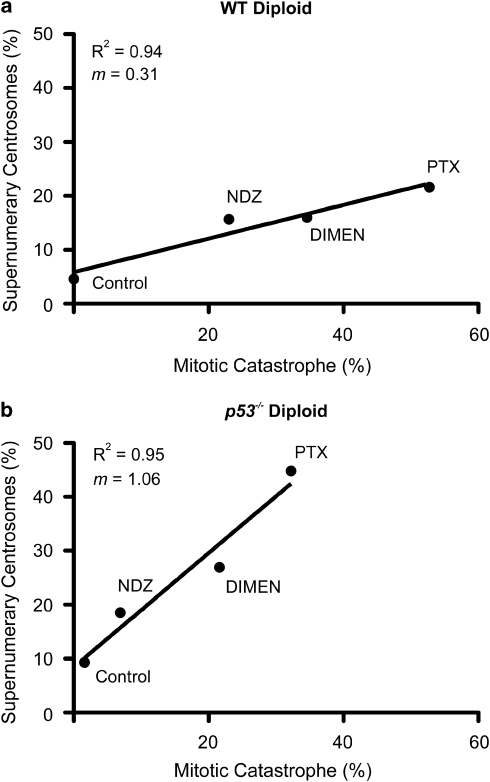
Mitotic catastrophe can be defined as a cell death mode that occurs during or shortly after a prolonged/aberrant mitosis, and can show apoptotic or necrotic features. However, conventional procedures for the detection of apoptosis or necrosis, including biochemical bulk assays and cytofluorometric techniques, cannot discriminate among pre-mitotic, mitotic and post-mitotic death, and hence are inappropriate to monitor mitotic catastrophe. To address this issue, we generated isogenic human colon carcinoma cell lines that differ in ploidy and p53 status, yet express similar amounts of fluorescent biosensors that allow for the visualization of chromatin (histone H2B coupled to green fluorescent protein (GFP)) and centrosomes (centrin coupled to the Discosoma striata red fluorescent protein (DsRed)). By combining high-resolution fluorescence videomicroscopy and automated image analysis, we established protocols and settings for the simultaneous assessment of ploidy, mitosis, centrosome number and cell death (which in our model system occurs mainly by apoptosis). Time-lapse videomicroscopy showed that this approach can be used for the high-throughput detection of mitotic catastrophe induced by three mechanistically distinct anti-mitotic agents (dimethylenastron (DIMEN), nocodazole (NDZ) and paclitaxel (PTX)), and - in this context - revealed an important role of p53 in the control of centrosome number.


Figures

Figure 1
Figure 1
Characterization of human colon cancer HCT 116 cells stably co-expressing H2B-GFP and DsRed-Centrin. (a) Normal cell cycle progression of wild-type (WT) diploid HCT 116 cells engineered for the stable co-expression of H2B-GFP and DsRed-Centrin (which allow for the detection of chromatin status and centrosome number, respectively) was monitored by time-lapse videomicroscopy. Snapshots taken at the indicated time are shown (scale bar=10 μm). The full-length movie is available as Supplementary Video 1. (b) Hemocytometric cell counting showed that the growth rates of both WT and p53−/− HCT 116 cells co-transfected with H2B-GFP and DsRed-Centrin do not differ from those of their untransfected counterparts. (c) Cytofluorometric analysis upon Hoechst 33342 staining of parental and stably transfected WT and p53−/− HCT 116 cells confirmed that H2B-GFP/DsRed-Centrin co-expression fails to affect cell cycle distribution. (d) Time-lapse videomicroscopy of p53−/− tetraploid HCT 116 cells co-expressing H2B-GFP and DsRed-Centrin was used to monitor supernumerary centrosomes, multipolar metaphases and asymmetrical cytokinesis, which reportedly characterize their untransfected counterparts (scale bar=10 μm). The full-length movie is available as Supplementary Video 2. DsRed, Discosoma striata red fluorescent protein; GFP, green fluorescent protein; H2B, histone H2B
Figure 2
Figure 2
Automated image analysis for the detection of cell death. (a) Fluorescence microphotographs of wild-type (WT) diploid HCT 116 cells co-expressing biosensors for the detection of chromatin status and centrosome number (H2B-GFP and DsRed-Centrin, respectively) – either left untreated (Control) or incubated for 72 h with paclitaxel (PTX), dimethylenastron (DIMEN), nocodazole (NDZ) or 7-hydroxystaurosporine (UCN-01) – were processed for the creation of the following segmentation masks: nuclei (pink), cells=nuclei+10 pixels (pink+blue); centrosomes (white or green, depending whether they are superposed or not to other regions of interest (ROIs)) (scale bar=10 μm). (b) Automated cell counting within microphotographs allowed for an indirect assessment of cell survival (untreated cultures were used as a control for the relative estimation of cell number). (c) The indirect quantification of cell survival by colorimetric assays based on the conversion of the tetrazolium salt WST-1 provided similar results. The fraction of surviving cells (WST-1 conversion normalized to the mean of control conditions) is depicted (mean±S.E.M., n=3 independent experiments). AU, arbitrary unit; DsRed, Discosoma striata red fluorescent protein; GFP, green fluorescent protein; H2B, histone H2B
Figure 3
Figure 3
Automated detection of mitotic arrest. (a) Wild-type (WT) diploid HCT 116 cells were engineered for the co-expression of H2B-GFP and DsRed-Centrin (allowing for the visualization of chromatin and centrosomes, respectively). Fluorescence microphotographs of these cells in untreated conditions (Control) or after a 8 h-long incubation with paclitaxel (PTX), dimethylenastron (DIMEN), nocodazole (NDZ), 7-hydroxystaurosporine (UCN-01) or staurosporine (STS) show that mitotic blockers (but not pro-apoptotic molecules) induced an increase in mitotic figures (scale bar=10 μm). (b) PTX, DIMEN and NDZ (but not pro-apoptotic triggers) generated distinctive cell populations (corresponding to mitotic events) that localized in the quadrant defined by values higher than 550 and 250 arbitrary units (AUs) on a nuclear granularity versus nuclear mean densitometry plot, respectively. (c) Each mitotic blocker led to a specific nuclear morphology (namely, ‘semicircular', ‘circular' and ‘solid' nuclei as induced by PTX, DIMEN and NDZ, respectively), which correlated with the distribution of nuclear granularity values (scale bar=10 μm). (d) Fluorescence microphotographs were taken from WT diploid, p53−/− diploid, WT tetraploid, p53−/− tetraploid HCT 116 cells kept in untreated conditions (Control) or treated as in (a). Subsequent automated counting of events with nuclear granularity and nuclear mean densitometry higher than 550 and 250 AU, respectively, allowed for the quantification of cells in metaphase. (e) Fluorescence microscopy data were confirmed by the parallel assessment of cell cycle distribution by Hoechst 33342 staining and cytofluorometric quantification of cells with a G2/M DNA content. Columns depict mean values±S.E.M. as recorded from three independent experiments. DsRed, Discosoma striata red fluorescent protein; GFP, green fluorescent protein; H2B, histone H2B
Figure 4
Figure 4
Mitotic blockers lead to increased nuclear area and to the generation of supernumerary centrosomes. Wild-type (WT) diploid HCT 116 cells co-expressing H2B-GFP and DsRed-Centrin (which allow for the monitoring of chromatin status and centrosome number, respectively) were left untreated (Control, a) or incubated with paclitaxel (PTX, b), dimethylenastron (DIMEN, c), nocodazole (NDZ, d), 7-hydroxystaurosporine (UCN-01, e) for 72 h. Fluorescence microphotographs taken at this time point were then automatically analyzed for the quantification of nuclear area and the number of centrosomes per cell (within the surviving cell population). Microphotographs and quantitative data representative of one out of three independent experiments are shown (scale bar=10 μm). DsRed, Discosoma striata red fluorescent protein; GFP, green fluorescent protein; H2B, histone H2B
Figure 5
Figure 5
Automatic analysis of fluorescence microphotographs allows for the assessment of polyploidization. Human colon carcinoma HCT 116 cells with the indicated ploidy and p53 status stably expressing fusion proteins for the detection of chromatin status (H2B-GFP) and centrosome number (DsRed-Centrin) were left untreated (Control) or incubated with paclitaxel (PTX), dimethylenastron (DIMEN), nocodazole (NDZ) or 7-hydroxystaurosporine (UCN-01) for 72 h. (a) Automated analysis of fluorescence microphotographs allowed for the quantification of nuclear area. Columns depict the mean of the median values±S.E.M., as recorded in three independent experiments. Mitotic blockers (but not UCN-01) provoked a relevant increase in the nuclear area of both diploid and tetraploid cells, irrespective of their p53 status. (b) Cytofluorometric analysis upon Hoechst 33342 staining confirmed that, in clear contrast to UCN-01, mitotic inhibitors (in particular PTX and NDZ) led to the accumulation of cells with a DNA content ⩾G2/M, in both diploid and tetraploid cells. As at this time point mitotic cells were not detectable by imaging (data not shown), these events represented bona fide aneuploid cells. (c) Automated quantification of the number of centrosomes per cell (No. of Centr.) suggested that p53−/− HCT 116 cells tended to accumulate supernumerary centrosomes more readily than their wild-type (WT) counterparts. In (b) and (c), data are mean values±S.E.M. (n=3 independent experiments)
Figure 6
Figure 6
Time-lapse videomicroscopy of mitotic cell death in HCT 116 cells stably co-expressing DsRed-Centrin and H2B-GFP. Wild-type (WT) and p53−/−diploid human colon carcinoma HCT 116 cells stably co-expressing H2B-GFP and DsRed-Centrin (which allow for the visualization of chromatin and centrosomes, respectively) were left untreated (Control) or kept for 8 h in the presence of paclitaxel (PTX), dimethylenastron (DIMEN), nocodazole (NDZ) or 7-hydroxystaurosporine (UCN-01), and then monitored by videomicroscopy (upon addition of the vital dye TO-PRO-3) for the subsequent 36 h (still in the presence of the indicated drug). Please note that time 0 coincides with the beginning of videomicroscopic assessments (8 h after drug administration). (a) WT diploid cells treated with PTX show typical features of mitotic catastrophe: nuclei in metaphase directly undergo shrinkage well before TO-PRO-3 incorporation (which reflects plasma membrane permeabilization). (b) Upon NDZ administration, p53−/− diploid cells tended to show mitotic slippage to interphase before cell death. In this representative snapshot series, karyorrhexis occurred approximately 10 h after the recovery of interphase and preceded the uptake of TO-PRO-3. Scale bars=10 μm. Full-length movies for (a) and (b) are available as Supplementary Videos 3 and 4, respectively. (c) The fate of more than 50 single cells from at least three distinct movies was monitored by fluorescence videomicroscopy for up to 36 h, cataloged and quantified according to the indicated events, which allowed for the generation of specific cell-fate profiles. Additional illustrations that depict the cataloged events and explain cell-fate diagrams are provided in Supplementary Figure 4. Thus, when compared with their WT counterparts (d), p53−/− diploid cells (e) showed an increased resistance to mitotic catastrophe (as induced by PTX, DIMEN and NDZ) in association with a higher propensity to mitotic slippage. DsRed, Discosoma striata red fluorescent protein; GFP, green fluorescent protein; H2B, histone H2B
Figure 7
Figure 7
Linear correlation between the percentage of cells with supernumerary centrosomes and the incidence of mitotic catastrophe. Wild-type (WT) and p53−/− diploid human colon carcinoma HCT 116 cells that constitutively co-express biosensors for the detection of chromatin status and centrosomes were cultured for 8 h in the absence (Control) or in the presence of paclitaxel (PTX), dimethylenastron (DIMEN), nocodazole (NDZ) or 7-hydroxystaurosporine (UCN-01), and then monitored by videomicroscopy for the automated quantification of the number of centrosomes per cell and of mitotic catastrophe. In both WT (a) and p53−/− (b) diploid cells, the percentage of cells characterized by supernumerary centrosomes linearly correlated with the incidence of mitotic catastrophe. Data are mean values from three independent experiments. m=slope; R2=coefficient of determination

References

    1. Kroemer G, Galluzzi L, Brenner C. Mitochondrial membrane permeabilization in cell death. Physiol Rev. 2007;87:99–163. - PubMed
    1. Galluzzi L, Morselli E, Kepp O, Kroemer G. Targeting post-mitochondrial effectors of apoptosis for neuroprotection. Biochim Biophys Acta. 2009;1787:402–413. - PubMed
    1. Galluzzi L, Blomgren K, Kroemer G. Mitochondrial membrane permeabilization in neuronal injury. Nat Rev Neurosci. 2009;10:481–494. - PubMed
    1. Galluzzi L, Larochette N, Zamzami N, Kroemer G. Mitochondria as therapeutic targets for cancer chemotherapy. Oncogene. 2006;25:4812–4830. - PubMed
    1. Kroemer G, Galluzzi L, Vandenabeele P, Abrams J, Alnemri ES, Baehrecke EH, et al. Classification of cell death: recommendations of the Nomenclature Committee on Cell Death 2009. Cell Death Differ. 2009;16:3–11. - PMC - PubMed

Publication types

Substances