. 2010 Jun 3;1(6):e49.
doi: 10.1038/cddis.2010.26.

XIAP impairs Smac release from the mitochondria during apoptosis

Affiliations

XIAP impairs Smac release from the mitochondria during apoptosis

L Flanagan et al. Cell Death Dis. .

Abstract

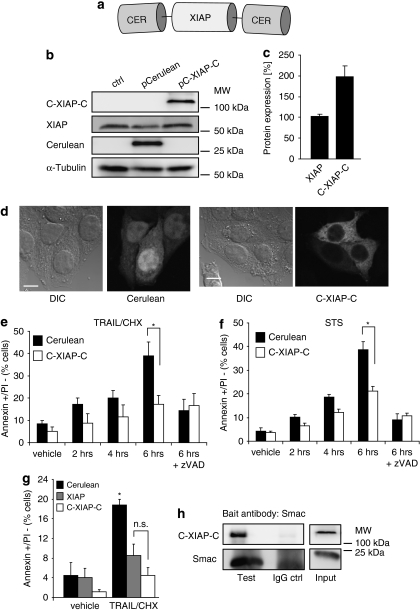
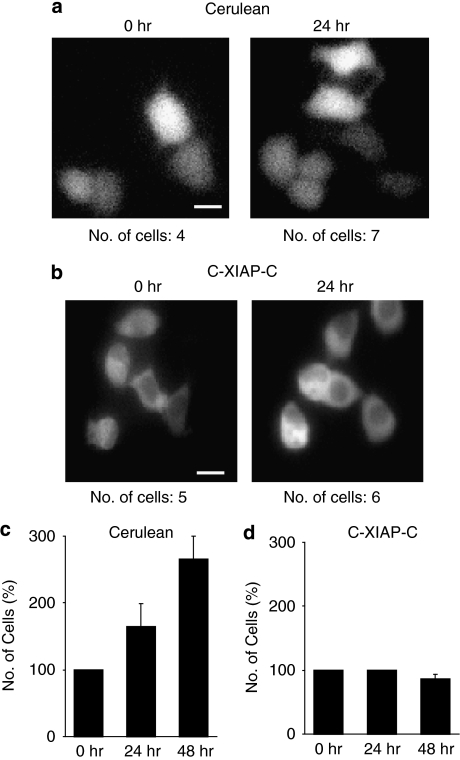
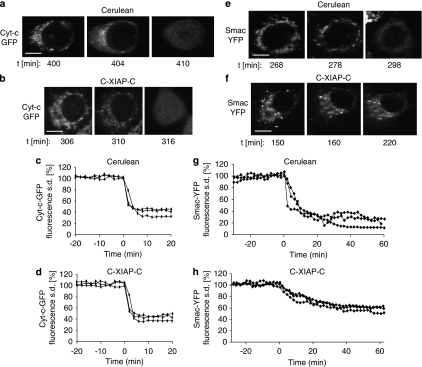
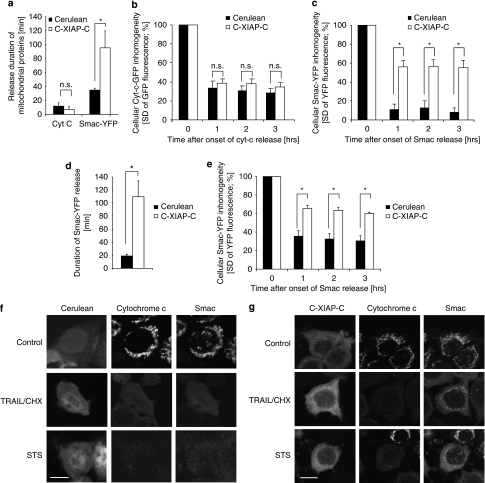
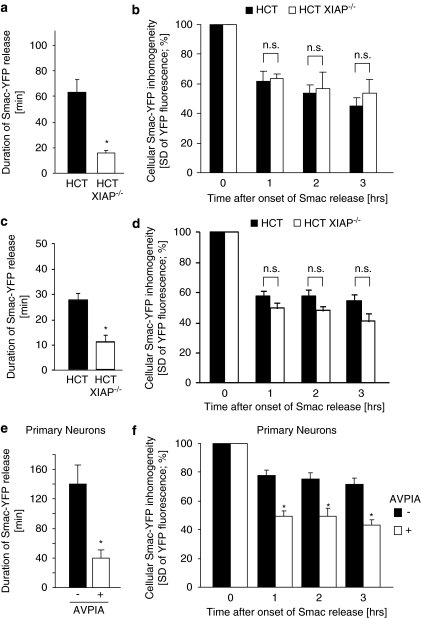
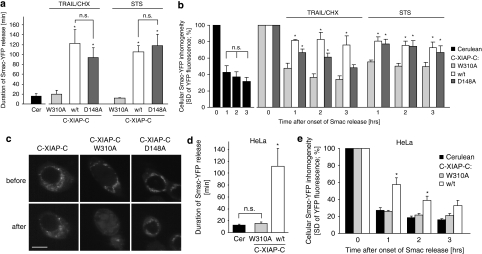
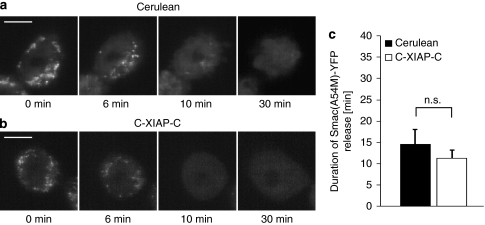
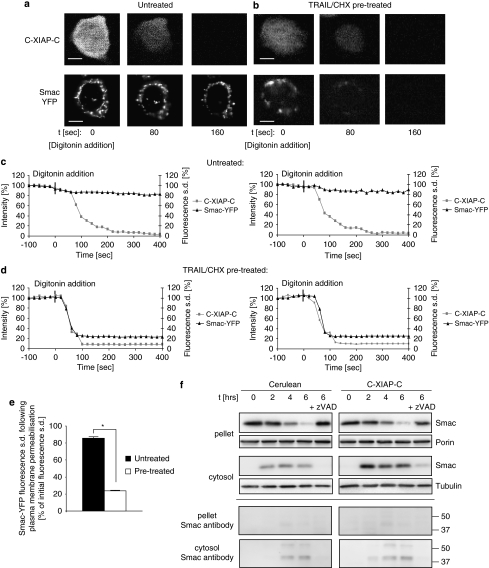
X-linked inhibitor of apoptosis protein (XIAP) is a potent inhibitor of caspases 3, 7 and 9, and mitochondrial Smac (second mitochondria-derived activator of caspase) release during apoptosis inhibits the activity of XIAP. In this study we show that cytosolic XIAP also feeds back to mitochondria to impair Smac release. We constructed a fluorescent XIAP-fusion protein by labelling NH(2)- and COOH-termini with Cerulean fluorescent protein (C-XIAP-C). Immunoprecipitation confirmed that C-XIAP-C retained the ability to interact with Smac and impaired extrinsically and intrinsically activated apoptosis in response to tumour necrosis factor-related apoptosis-inducing ligand/cycloheximide and staurosporine. In C-XIAP-C-expressing cells, cytochrome c release from mitochondria proceeded normally, whereas Smac release was significantly prolonged and incomplete. In addition, physiological expression of native XIAP prolonged or limited Smac release in HCT-116 colon cancer cells and primary mouse cortical neurons. The Smac-binding capacity of XIAP, but not caspase inhibition, was central for mitochondrial Smac retention, as evidenced in experiments using XIAP mutants that cannot bind to Smac or effector caspases. Similarly, the release of a Smac mutant that cannot bind to XIAP was not impaired by C-XIAP-C expression. Full Smac release could however be provoked by rapid cytosolic C-XIAP-C depletion upon digitonin-induced plasma membrane permeabilization. Our findings suggest that although mitochondria may already contain pores sufficient for cytochrome c release, elevated amounts of XIAP can selectively impair and limit the release of Smac.


Figures

Figure 1
Figure 1
Characterization of a fluorescent XIAP fusion protein. (a) The generated XIAP fusion protein (C-XIAP-C). Full-length XIAP was fused at both NH2 and COOH termini with Cerulean fluorescent protein to allow for highly sensitive XIAP detection. (b) Parental MCF-7 cells as well as MCF-7 cells transiently transfected to express Cerulean or C-XIAP-C were probed with antibodies against Cerulean or XIAP. C-XIAP-C was detected at its expected molecular weight of 109 kD. α-Tubulin served as loading control. (c) Comparative quantification of XIAP and C-XIAP-C expression in MCF-7 cells. Densitometry was performed on digitally recorded 12-bit images of immunoblots probed with a XIAP antibody. Data are means+S.E.M. from n=3 detections. (d) Expression of C-XIAP-C does not affect cellular morphology. Cells were imaged 24 h after transfection. Cerulean fluorescence was found throughout the cell, whereas C-XIAP-C was predominantly found in the cytosol. Scale bar=10 μm. (e, f) C-XIAP-C inhibits apoptosis. MCF-7 cells transiently transfected to express Cerulean or C-XIAP-C were exposed to TRAIL/CHX (100 ng/ml plus 1 μg/ml) or STS (1 μM) for the indicated times and analysed by flow cytometry. Apoptosis was measured as the percentage of annexin V-FITC-positive/PI-negative cells. Addition of caspase inhibitor zVAD-fmk (50 μM) indicated that the apoptotic response to TRAIL/CHX or STS was caspase dependent. Data are shown as mean+S.D. from n=3 samples. *Significant differences (P<0.05; one-way ANOVA and subsequent Tukey's test). Experiments were repeated with similar results. (g) C-XIAP-C has an anti-apoptotic potency comparable to native XIAP. MCF-7 cells transiently transfected to express Cerulean, XIAP or C-XIAP-C were exposed to TRAIL/CHX (100 ng/ml plus 1 μg/ml) for 4 h and analysed by flow cytometry. Apoptosis was measured as the percentage of annexin V-FITC-positive/PI-negative cells. Data are shown as mean+S.D. from n=3 independent samples. *Significant induction of apoptosis (P<0.05); NS, not significant (one-way ANOVA and subsequent Tukey's test). Experiment was repeated with similar results. (h) C-XIAP-C interacts with Smac. XIAP-deficient HCT-116 cells transiently transfected to express C-XIAP-C were lysed and immunoprecipitation was performed in native cell extracts with a Smac bait antibody. After western blotting, C-XIAP-C was detected with an antibody directed against XIAP
Figure 2
Figure 2
Expression of C-XIAP-C impairs cell proliferation. (a, b) Cell proliferation was observed by fluorescence microscopy of Cerulean- or C-XIAP-C-expressing MCF-7 cells. Comparison of cell numbers after 24 h suggested that proliferation of C-XIAP-C-expressing cells was impaired. Scale bars=20 μm. (c, d) Identical fields of view of Cerulean- or C-XIAP-C-expressing cells were re-examined after 24 and 48 h and the number of fluorescent cells were recorded. Quantifications from n=3 experiments indicated that Cerulean-expressing MCF-7 cells continued to proliferate whereas expression of C-XIAP-C induced growth arrest. Error bars represent S.E.M.
Figure 3
Figure 3
Cyt-c-GFP and Smac-YFP release in the presence of C-XIAP-C expression. (a, b) A Cerulean-expressing or a C-XIAP-C-expressing MCF-7 cell releasing cyt-c-GFP in response to 100 ng/ml TRAIL plus 1 μg/ml CHX is shown. Upon release, cyt-c-GFP fluorescence redistributed from the mitochondria into the cytosol. Time indicates minutes after stimulus addition. Scale bar=10 μm. (c, d) Temporal profiles of cyt-c-GFP release in Cerulean-expressing (c) or C-XIAP-C-expressing (d) MCF-7 cells. The cyt-c-GFP release process was plotted as the change in cellular fluorescence S.D. and shown for three representative cells. Release onset was set to time zero. Cyt-c-GFP release proceeded rapidly. A total of n=10 Cerulean-expressing cells or n=19 C-XIAP-C-expressing cells from 4 or 6 experiments were analysed, respectively. (e) A Cerulean-expressing MCF-7 cell releasing Smac-YFP in response to 100 ng/ml TRAIL plus 1 μg/ml CHX is shown. Upon release, Smac-YFP fluorescence redistributed from the mitochondria to the cytosol. Time indicates minutes after stimulus addition. Scale bar=10 μm. (f) A C-XIAP-C-expressing MCF-7 cell releasing Smac-YFP in response to 100 ng/ml TRAIL plus 1 μg/ml CHX is shown. Smac-YFP fluorescence redistribution from the mitochondria to the cytosol seemed incomplete even after prolonged times. Time indicates minutes after stimulus addition. Scale bar=10 μm. (g, h) Temporal profiles of Smac-YFP release in Cerulean-expressing (g) or C-XIAP-C-expressing (h) MCF-7 cells. The Smac-YFP release process was plotted as the change in cellular fluorescence S.D. and shown for three representative cells. Release onset was set to time zero. Smac-YFP release in C-XIAP-C-expressing cells was slow and the loss in fluorescence S.D. was less pronounced when compared with Cerulean-expressing cells. A total of n=13 Cerulean-expressing cells or n=17 C-XIAP-C-expressing cells from 6 or 8 experiments were analysed, respectively
Figure 4
Figure 4
Elevated XIAP expression results in significantly prolonged and submaximal release of Smac. (a) The duration of cyt-c-GFP or Smac-YFP release in response to 100 ng/ml TRAIL/1 μg/ml CHX was quantified for all MCF-7 cells measured and statistically compared. Cyt-c-GFP release durations were from 10 and 19 cells expressing Cerulean or C-XIAP-C, respectively. Smac-YFP release durations were from 13 and 17 cells expressing Cerulean or C-XIAP-C, respectively. Error bars represent S.E.M. *P<0.05; NS, not significant (Student's t-tests). (b) Comparison of amounts of cyt-c-GFP released in response to 100 ng/ml TRAIL/1 μg/ml CHX in cells expressing Cerulean or C-XIAP-C. Cellular fluorescence S.D. for 10 and 19 cells per group were compared at 1, 2 and 3 h after onset of cyt-c-GFP release. No significant difference could be detected between Cerulean- or C-XIAP-C-expressing MCF-7 cells. Error bars represent S.E.M. NS, not significant (Student's t-tests). (c) Comparison of amounts of Smac-YFP released in response to 100 ng/ml TRAIL/1 μg/ml CHX in cells expressing Cerulean or C-XIAP-C. Cellular fluorescence S.D. for 13 and 17 cells per group were compared at 1, 2 and 3 h after onset of Smac-YFP release. Significantly less Smac-YFP was released in MCF-7 cells expressing C-XIAP-C. Error bars represent S.E.M. *P<0.05, Student's t-tests. (d) As in (a), release durations of Smac-YFP were compared in MCF-7 cells exposed to 1 μM STS (n=8 or 11 cells per group). Smac release was significantly prolonged in cells expressing C-XIAP-C. Error bars represent S.E.M. *P<0.05, Student's t-test. (e) Comparison of amounts of Smac-YFP released in response to 1 μM STS in cells expressing Cerulean or C-XIAP-C. Cellular fluorescence S.D. for 8 and 11 cells per group were compared at 1, 2 and 3 h after onset of Smac-YFP release. Significantly less Smac-YFP was released in MCF-7 cells expressing C-XIAP-C. Error bars represent S.E.M. *P<0.05, Student's t-tests. (f, g) Immunofluorescence scans of native cyt-c and Smac in Cerulean-expressing (f) or C-XIAP-C-expressing (g) MCF-7 cells. Cells expressing Cerulean co-released both cyt-c and Smac (f). In C-XIAP-C-expressing cells, Smac was partially retained in the mitochondria, whereas cyt-c was apparently fully released in response to both TRAIL/CHX and STS (g). Scale bars=10 μm
Figure 5
Figure 5
Physiological XIAP expression can impair Smac release. (a) The duration of Smac-YFP release in response to 100 ng/ml TRAIL/1 μg/ml CHX was quantified for parental and XIAP-deficient HCT-116 cells. Data are means from n=10 and 7 cells per group. Error bars represent S.E.M. *Significant acceleration of Smac release (P<0.05; Student's t-test). (b) Comparison of amounts of Smac-YFP released in response to 100 ng/ml TRAIL/1 μg/ml CHX. Cellular fluorescence S.D. for 10 and 7 cells per group were compared at 1, 2 and 3 h after onset of Smac release. Data are shown as means; error bars represent S.E.M. NS, not significant (Student's t-test). (c) The duration of Smac-YFP release in response to 1 μM STS was quantified for parental and XIAP-deficient HCT-116 cells. Data are means from n=8 and 5 cells per group. Error bars represent S.E.M. *Significant acceleration of Smac release (P<0.05; Student's t-test). (d) Comparison of amounts of Smac-YFP released in response to 1 μM STS. Cellular fluorescence S.D. for 8 and 5 cells per group were compared at 1, 2 and 3 h after onset of Smac release. Data are shown as means; error bars represent S.E.M. NS, not significant (Student's t-test). (e) The duration of Smac-YFP release in mouse cortical neurons in response to 300 nM STS was quantified either in the presence or absence of an IAP-antagonizing peptide. Data are means from n=10 and 12 cells per group. Error bars represent S.E.M. *Significant acceleration of Smac release (P<0.05; Student's t-test). (f) Comparison of amounts of Smac-YFP released in mouse cortical neurons. Cellular fluorescence S.D. for 10 and 12 cells per group were compared at 1, 2 and 3 h after onset of Smac release. Data are shown as means, error bars represent S.E.M. *Significant differences in Smac release (P<0.05; Student's t-test)
Figure 6
Figure 6
Impairment of Smac release requires Smac–XIAP interaction but not effector caspase inhibition. (a) The duration of Smac-YFP release in response to TRAIL/CHX (100 ng/ml, 1 μg/ml) or STS (1 μM) was quantified for XIAP-deficient HCT-116 cells expressing Cerulean, C-XIAP-C or variants thereof bearing W310A or D148A point mutations. Data are means from n=4 control cells, or 8, 11 and 10 cells per group (TRAIL/CHX) or 6, 5 and 7 cells per group (STS). Error bars represent S.E.M. *Significantly prolonged Smac release (P<0.05; ANOVA and subsequent Tukey's test; NS, not significant). (b) Comparison of amounts of Smac-YFP released in response to TRAIL/CHX or STS. Cellular fluorescence S.D. for n=4 control cells, or 8, 11 and 10 cells per group (TRAIL/CHX) or 6, 5 and 7 cells per group (STS) were compared at 1, 2 and 3 h after onset of Smac release. Data are shown as means; error bars represent S.E.M. *Significant mitochondrial Smac retention (P<0.05; ANOVA and subsequent Tukey's test). (c) Representative images of Smac-YFP fluorescence in HCT-116 XIAP−/− cells expressing C-XIAP-C or its variants before and 60 min after onset of Smac-YFP release. Full Smac release was only observed in cells expressing C-XIAP-C W310A. Scale bar=10 μm. (d) The duration of Smac-YFP release in response to 100 ng/ml TRAIL/1 μg/ml CHX was quantified for HeLa cells expressing Cerulean, C-XIAP-C or C-XIAP-C W310A. Data are means from n=9, 7 and 7 cells per group. Error bars represent S.E.M. *Significantly prolonged Smac release (P<0.05; ANOVA and subsequent Tukey's test; NS, not significant). (e) Comparison of amounts of Smac-YFP released in response to 100 ng/ml TRAIL/1 μg/ml CHX. Cellular fluorescence S.D. for n=9, 7 and 7 cells per group were compared at 1, 2 and 3 h after onset of Smac release. Data are shown as means; error bars represent S.E.M. *Significant mitochondrial Smac retention (P<0.05; ANOVA and subsequent Tukey's test)
Figure 7
Figure 7
Release of Smac(A54M)-YFP is not impaired by XIAP. (a, b) Representative Cerulean-expressing (a) or C-XIAP-C-expressing (b) HCT Smac−/− cells releasing Smac(A54M)-YFP in response to 100 ng/ml TRAIL+1 μg/ml CHX are shown. Upon release, Smac(A54M)-YFP fluorescence redistributed from the mitochondria into the cytosol. Onset of release was set to time zero. Release was complete in all cells investigated. Scale bar=10 μm. (c) The duration of Smac(A54M)-YFP release was quantified for all HCT Smac−/− cells measured. Data are means from n=4 Cerulean-expressing and n=6 C-XIAP-C-expressing cells. Error bars represent S.E.M. (NS, not significant; Student's t-test)
Figure 8
Figure 8
Plasma membrane permeabilization causes rapid cytosolic depletion of XIAP and re-establishes Smac release. (a) Representative images of the response of an untreated MCF-7 Smac-YFP cell to digitonin-based plasma membrane permeabilization. Upon permeabilization, C-XIAP-C fluorescence was lost from the cytosol. Mitochondrial Smac-YFP fluorescence did not noticeably change. Scale bar=10 μm. (b) Representative images of the response of a TRAIL/CHX pre-treated MCF-7 Smac-YFP cell to digitonin-based plasma membrane permeabilization. Upon permeabilization, C-XIAP-C fluorescence was lost from the cytosol. Mitochondrial Smac-YFP was lost in parallel. Scale bar=10 μm. (c, d) Temporal profiles of Smac-YFP and C-XIAP-C release in untreated (c) or TRAIL/CHX pre-treated (d) MCF-7 Smac-YFP cells. Smac-YFP release was plotted as the change in cellular fluorescence S.D., C-XIAP-C loss was plotted as the change in cellular fluorescence intensity. Two representative cells are shown each. Release onset was set to time zero. A total of n=4 untreated cells or n=8 pre-treated cells from three experiments each were analysed. (e) Comparison of amounts of Smac-YFP released after permeabilization of untreated or TRAIL/CHX pre-treated cells expressing C-XIAP-C. Cellular fluorescence S.D. for 4 and 8 cells per group were compared at 5 min after onset of C-XIAP-C loss. Error bars represent S.E.M. *P<0.05 (Student's t-test). (f) Mitochondrial Smac retention cannot be detected by biochemical fractionation. MCF-7 cells transfected to express Cerulean or C-XIAP-C were treated with TRAIL/CHX for the indicated times and subjected to digitonin-based biochemical fractionation. Smac release was detected by immunoblotting. Longer exposures were used to detect signals corresponding to poly-ubiquitinated Smac (calculated molecular weights of 44 and 52.5 kDa, respectively). Porin and α-tubulin served as loading controls. Experiment was repeated eight times with similar results

References

    1. Rehm M, Dussmann H, Janicke RU, Tavare JM, Kogel D, Prehn JH. Single-cell fluorescence resonance energy transfer analysis demonstrates that caspase activation during apoptosis is a rapid process. Role of caspase-3. J Biol Chem. 2002;277:24506–24514. - PubMed
    1. Deveraux QL, Roy N, Stennicke HR, Van Arsdale T, Zhou Q, Srinivasula SM, et al. IAPs block apoptotic events induced by caspase-8 and cytochrome c by direct inhibition of distinct caspases. EMBO J. 1998;17:2215–2223. - PMC - PubMed
    1. Rehm M, Huber HJ, Dussmann H, Prehn JH. Systems analysis of effector caspase activation and its control by X-linked inhibitor of apoptosis protein. EMBO J. 2006;25:4338–4349. - PMC - PubMed
    1. Potts MB, Vaughn AE, McDonough H, Patterson C, Deshmukh M. Reduced Apaf-1 levels in cardiomyocytes engage strict regulation of apoptosis by endogenous XIAP. J Cell Biol. 2005;171:925–930. - PMC - PubMed
    1. Potts PR, Singh S, Knezek M, Thompson CB, Deshmukh M. Critical function of endogenous XIAP in regulating caspase activation during sympathetic neuronal apoptosis. J Cell Biol. 2003;163:789–799. - PMC - PubMed

Publication types

MeSH terms