. 2011 Feb 25;6(2):e17412.
doi: 10.1371/journal.pone.0017412.

Starvation induced cell death in autophagy-defective yeast mutants is caused by mitochondria dysfunction

Affiliations

Starvation induced cell death in autophagy-defective yeast mutants is caused by mitochondria dysfunction

Sho W Suzuki et al. PLoS One. .

Abstract

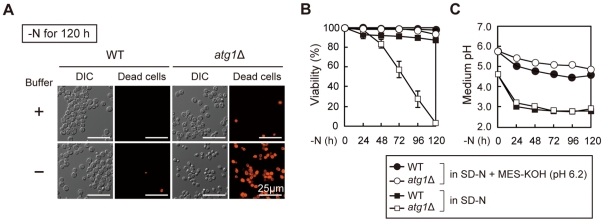
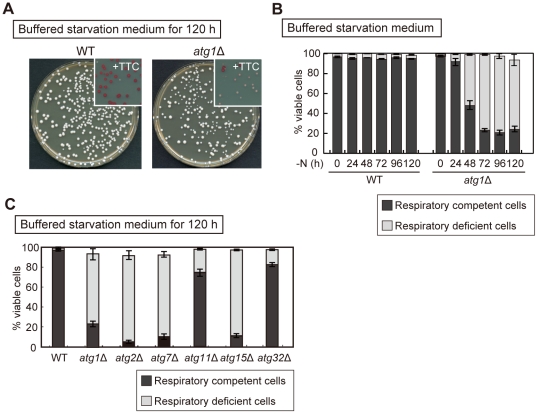
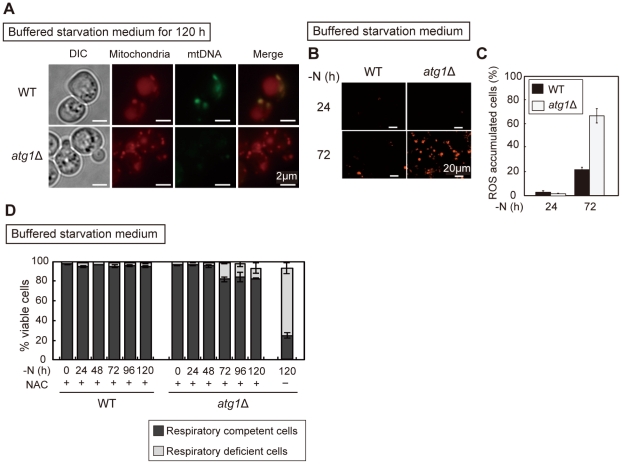
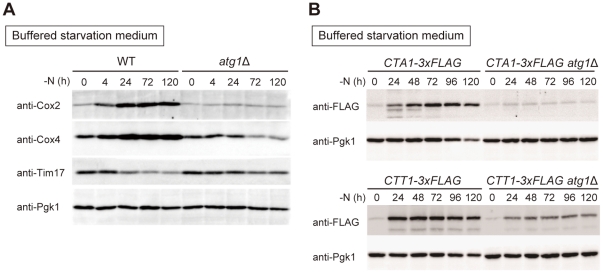
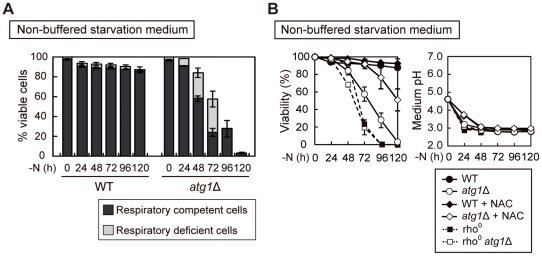
Autophagy is a highly-conserved cellular degradation and recycling system that is essential for cell survival during nutrient starvation. The loss of viability had been used as an initial screen to identify autophagy-defective (atg) mutants of the yeast Saccharomyces cerevisiae, but the mechanism of cell death in these mutants has remained unclear. When cells grown in a rich medium were transferred to a synthetic nitrogen starvation media, secreted metabolites lowered the extracellular pH below 3.0 and autophagy-defective mutants mostly died. We found that buffering of the starvation medium dramatically restored the viability of atg mutants. In response to starvation, wild-type (WT) cells were able to upregulate components of the respiratory pathway and ROS (reactive oxygen species) scavenging enzymes, but atg mutants lacked this synthetic capacity. Consequently, autophagy-defective mutants accumulated the high level of ROS, leading to deficient respiratory function, resulting in the loss of mitochondria DNA (mtDNA). We also showed that mtDNA deficient cells are subject to cell death under low pH starvation conditions. Taken together, under starvation conditions non-selective autophagy, rather than mitophagy, plays an essential role in preventing ROS accumulation, and thus in maintaining mitochondria function. The failure of response to starvation is the major cause of cell death in atg mutants.


Conflict of interest statement

Competing Interests: The authors have declared that no competing interests exist.

Figures

Figure 1
Figure 1. The viability of atg mutants in buffered starvation medium.
(A) WT and atg1Δ cells grown in YEPD medium were transferred to SD-N or SD-N +50 mM MES-KOH (pH 6.2) medium for 120 hours, and dead cells stained by phloxine B were observed by fluorescent microscopy. Scale bar, 25 µm. (B–C) WT and atg1Δ cells grown nitrogen starved as (A) for the indicated times. Cell viability (B) and medium pH (C) were examined by phloxine B staining and pH meter, respectively. These data represent the average of three independent experiments and bars indicate standard deviations.
Figure 2
Figure 2. Loss of respiratory function in atg mutants during nitrogen starvation.
(A) WT and atg1Δ cells grown in YEPD medium were transferred to SD-N +50 mM MES-KOH (pH 6.2). After 120 hours, cultures were diluted 5.0×10⁵ fold and plated onto YEPD agar. The plates were incubated at 30°C for four days. Insets indicate the plate overlaid with TTC agar to examine the respiratory competency of formed colonies. (B) WT, and atg1Δ cells were nitrogen-starved as (A). Cell viability and respiratory competency was determined by phloxine B staining and TTC overlay technique as (A), respectively. The black and gray areas indicate the percentage of viable cells that are respiratory competent or respiratory deficient, respectively. (C) WT, atg1Δ, atg2Δ, atg7Δ, atg11Δ, atg15Δ, and atg32Δ cells were nitrogen-starved as (A). Cell viability and respiratory competency was determined by phloxine B staining and TTC overlay technique as (A), respectively. The black and gray areas indicate the percentage of viable cells that are respiratory competent or respiratory deficient, respectively. These data represent the average of three independent experiments and bars indicate standard deviations.
Figure 3
Figure 3. Mitochondrial defect in atg mutants.
(A) WT and atg1Δ cells expressing mitochondria targeted mCherry cultured in SD-N +50 mM MES-KOH (pH 6.2) medium for 120 hours were observed by fluorescent microscopy. Mitochondrial DNA was stained with SYBR green I, and mitochondria were visualized by mitochondria targeted mCherry. Scale bar, 2 µm. (B–C) WT and atg1Δ cells were transferred to SD-N +50 mM MES-KOH (pH 6.2) medium for the indicated time. ROS accumulation was detected by DHE staining (B). Each photo contains about 200 cells. Scale bar, 20 µm. (C) shows quantification of ROS accumulated cells (n>200 cells). (D) WT and atg1Δ cells were transferred to SD-N +50 mM MES-KOH (pH 6.2) with 10 mM NAC for the indicated time. Cell viability was determined by phloxine B staining. Cells from these cultures were plated on YEPD agar and overlaid with TTC agar to examine respiratory competency. The black and gray areas indicate the percentage of viable cells that are respiratory competent or respiratory deficient, respectively. These data represent the average of three independent experiments and bars indicate standard deviations.
Figure 4
Figure 4. Altered expression of respiratory components and ROS scavengers by atg mutant cells.
(A) WT and atg1Δ cells were transferred to SD-N +50 mM MES-KOH (pH 6.2) medium for the indicated time. Lysates were prepared using the alkaline-trichloroacetic acid method and subjected to immunoprecipitation with anti-Cox2, anti-Cox4, anti-Tim17 and anti-Pgk1. Pgk1 was used as loading control. (B) WT and atg1Δ cells expressing Cta1-3×FLAG or Ctt1-3×FLAG were nitrogen-starved as in (A) for the indicated time. Cell lysates were prepared as (A) and subjected to immune precipitation with anti-FLAG and anti-Pgk1. Pgk1 was used as loading control.
Figure 5
Figure 5. Viability of respiratory deficient cells during nitrogen starvation.
(A) WT and atg1Δ cells were transferred to non-buffered SD-N medium for the indicated time. Cell viability was determined by phloxine B staining. Nitrogen-starved cells were plated onto YEPD agar and overlaid with TTC agar to examine the respiratory competency of formed colonies. The black and gray areas indicate the percentage of viable cells that are respiratory competent or respiratory deficient, respectively. (B) WT, atg1Δ, rho0, and rho0 atg1Δ cells grown in YEPD medium were transferred to SD-N with or without 10 mM NAC for the indicated time. In the presence of NAC, medium pH was adjusted by using KOH. Cell viability and medium pH were examined by phloxine B staining and pH meter, respectively. These data represent the average of three independent experiments and bars indicate standard deviations.

References

    1. Kornitzer D, Ciechanover A. Modes of regulation of ubiquitin-mediated protein degradation. J Cell Physiol. 2000;182:1–11. - PubMed
    1. Nakatogawa H, Suzuki K, Kamada Y, Ohsumi Y. Dynamics and diversity in autophagy mechanisms: lessons from yeast. Nat Rev Mol Cell Biol. 2009;10:458–467. - PubMed
    1. Mizushima N. Autophagy: process and function. Genes Dev. 2007;21:2861–2873. - PubMed
    1. Onodera J, Ohsumi Y. Autophagy is required for maintenance of amino acid levels and protein synthesis under nitrogen starvation. J Biol Chem. 2005;280:31582–31586. - PubMed
    1. Mizushima N. The pleiotropic role of autophagy: from protein metabolism to bactericide. Cell Death Differ. 2005;12:1535–1541. - PubMed

Publication types

MeSH terms