. 2011 Feb 25;6(2):e17039.
doi: 10.1371/journal.pone.0017039.

Gliadin-mediated proliferation and innate immune activation in celiac disease are due to alterations in vesicular trafficking

Affiliations

Gliadin-mediated proliferation and innate immune activation in celiac disease are due to alterations in vesicular trafficking

M Vittoria Barone et al. PLoS One. .

Abstract

Background and objectives: Damage to intestinal mucosa in celiac disease (CD) is mediated both by inflammation due to adaptive and innate immune responses, with IL-15 as a major mediator of the innate immune response, and by proliferation of crypt enterocytes as an early alteration of CD mucosa causing crypts hyperplasia. We have previously shown that gliadin peptide P31-43 induces proliferation of cell lines and celiac enterocytes by delaying degradation of the active epidermal growth factor receptor (EGFR) due to delayed maturation of endocytic vesicles. IL-15 is increased in the intestine of patients affected by CD and has pleiotropic activity that ultimately results in immunoregulatory cross-talk between cells belonging to the innate and adaptive branches of the immune response. Aims of this study were to investigate the role of P31-43 in the induction of cellular proliferation and innate immune activation.

Methods/principal findings: Cell proliferation was evaluated by bromodeoxyuridine (BrdU) incorporation both in CaCo-2 cells and in biopsies from active CD cases and controls. We used real-time PCR to evaluate IL-15 mRNA levels and FACS as well as ELISA and Western Blot (WB) analysis to measure protein levels and distribution in CaCo-2 cells. Gliadin and P31-43 induce a proliferation of both CaCo-2 cells and CD crypt enterocytes that is dependent on both EGFR and IL-15 activity. In CaCo-2 cells, P31-43 increased IL-15 levels on the cell surface by altering intracellular trafficking. The increased IL-15 protein was bound to IL15 receptor (IL-15R) alpha, did not require new protein synthesis and functioned as a growth factor.

Conclusion: In this study, we have shown that P31-43 induces both increase of the trans-presented IL-15/IL5R alpha complex on cell surfaces by altering the trafficking of the vesicular compartments as well as proliferation of crypt enterocytes with consequent remodelling of CD mucosa due to a cooperation of IL-15 and EGFR.


Conflict of interest statement

Competing Interests: The authors have declared that no competing interests exist.

Figures

Figure 1
Figure 1. P31-43-induced EGFR- and IL-15-dependent proliferation in CaCo-2 cells.
(A) Quantification of BrdU incorporation of CaCo-2 cells incubated overnight with medium alone, or treated as indicated. Columns represent the mean and bars represent the standard deviation of five independent experiments. More than 300 nuclei were counted for each experiment in several optical fields and the number of BrdU-positive cells was expressed as a proportion of the total nuclei. * = p<0.05 **p<0.01 (Student's t-test). (B) Immunofluorescence staining of BrdU incorporation of CaCo-2 cells treated as indicated. Hoechst stains of total nuclei. Single representative optical fields (63x objective).
Figure 2
Figure 2. P31-43-induced proliferation of crypt enterocytes in celiac disease (CD) biopsies in the active phase of the disease depends on EGFR and IL-15 functions.
(A) Quantification of BrdU incorporation of crypt enterocytes of intestinal biopsies from CD patients incubated with P31-43, with and without blocking antibodies anti-IL-15 and anti-EGFR. More than 300 cytokeratin-positive cells were counted in several fields in each sample and the number of BrdU-positive cells was expressed as a proportion of the total cytokeratin-positive cells. Mean and standard deviation of five independent experiments (Student's t test). ** = p<0.01; *** = p<0.001 (B) Quantification of BrdU incorporation of crypt enterocytes of intestinal biopsies from controls incubated with P31-43. More than 300 cytokeratin-positive cells were counted in several fields in each sample and the number of BrdU-positive cells was expressed as a proportion of the total cytokeratin-positive cells. Mean and standard deviation of three independent experiments (C) Immunofluorescence of crypts of duodenal biopsies from patients with active CD stained for cytokeratin to identify epithelial cells [red] and for BrdU [green]. Representative single optical field (40x objective). Lumen of the crypt is highlighted by white arrows. For methods, see supplementary material.
Figure 3
Figure 3. Overnight treatment with gliadin peptide P31-43, but not P57-68, increased levels of IL-15 mRNA in CaCo-2 cells.
Quantitative PCR analysis shows an increase of IL-15 mRNA after O/N treatment of CaCo-2 cells with P31-43 but not after 30 min, 3 h and 6 h. This increase can be prevented by IL-15 blocking antibodies. RQ = relative quantity of IL-15 mRNA. Columns represent means, and bars are standard deviations of a representative experiment done in triplicate. Four separate experiments show similar results. UN = untreated. For methods, see supplementary material.
Figure 4
Figure 4. Gliadin peptide P31-43 increased IL-15/IL-15R alpha complex on the cell surface in CaCo-2 cells.
(A) P31-43 increased IL-15 on the cell surface in CaCo-2 cells. FACS analysis of IL-15 on the cell surface after overnight (O/N), or 3 h or 6 h of treatment (B) with P31-43. Columns represent means and bars are the standard deviations of ten independent experiments for panel A and three independent experiments for panel B; * = p<0.05 (Student's t-test), ** = p<0.01 (Student's t-test) (C) Histogram of one representative experiment of CaCo-2 cells treated O/N with P31-43. Black dotted curve corresponds to negative control (isotype-matched Ab), the green open curve depicts specific IL-15 staining after medium treatment and pink open curve is specific IL-15 staining after O/N culture with P31-43.
Figure 5
Figure 5. Acid treatment and siIl15 mRNA reduce the increase of IL-15 expression on CaCo-2 cell surfaces induced by P31-43.
(A) FACS analysis of IL-15 on the cell surface after overnight (O/N) treatment with P31-43. Histogram of one representative experiment of CaCo-2 cells treated O/N with P31-43 and P31-43 plus acid treatment. Black dotted curve corresponds to negative control (isotype-matched Ab), the green open curve depicts specific mAb staining after medium treatment, pink open curve is specific mAb staining after O/N with P31-43 and the dotted pink open curve represents specific mAb staining after O/N with P31-43 plus acid treatment. Data are representative of one of five independent experiments. (B) siRNA IL-15R alpha reduces P31-43 mediated increase of IL-15 on CaCo-2 cell surfaces. FACS analysis of IL-15 on Caco-2 cell surfaces. Statistical analysis of ten independent experiments for UN (untreated) and P31-43 O/N treated cells and of four experiments for cells treated with siRNA IL-15R alpha. Columns represent means and bars are standard deviations. * = p<0.05 (Student's t-test). (C) Histogram of one representative experiment of CaCo-2 cells treated O/N with P31-43 and P31-43 plus SiRNA IL-15R alpha. The dotted black curve corresponds to the negative control (isotype-matched Ab), the green open curve depicts specific IL-15 staining after medium treatment, the pink open curve depicts specific IL-15 staining after treatment with P31-43 and the blue open curve represents specific IL-15 staining after O/N treatment with P31-43 in the presence of siRNA IL-15R alpha.
Figure 6
Figure 6. Both IL-15 and IL-15R-alpha expression increase in the isolated membrane fraction after stimulation with P31-43 for 30 min and 3 h.
A) Western blot analysis of membrane proteins separated from total cell lysates shows an increase in membrane protein fractions of IL-15 and IL-15R alpha after P31-43 treatment. B and C) densitometric analysis of the Western blot experiment shown in a. EGFR was used to normalise membrane protein measurements. Increments (i) of IL-15 and IL-15R alpha were calculated as follows: iIL-15 =  (IL-15 treated [t]/IL-15 untreated [un])/(EGFR Treated [T]/EGFR Untreated [UN]). iIL-15R  = (IL-15R [t]/Il-15R [un]/(EGFR [T]/EGFR [UN]). The blots shown are representative of three similar independent experiments.
Figure 7
Figure 7. P31-43 treatment increases, on the cell membrane, IL-15/IL-15R alpha association.
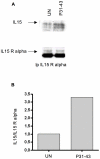
A) Demonstration of an IL-15/IL-15R alpha complex in an isolated membrane fraction. WB analysis of membrane proteins immunoprecipitated with IL-15R alpha antibodies. IL-15 and IL-15R alpha are visualized in the upper and lower gels with their respective antibodies. UN = untreated. B) Densitometric analysis of the Western blot experiment shown in (A). Fold increase of upper band of IL-15 (black arrow) was calculated respective to the IL-15R alpha band. The increment of IL-15 association (A) was calculated as follows: aIL-15 =  (IL-15 [t]/IL-15 [un])/(IL-15R alpha [T]/IL-15R alpha [UN]). The blot shown is representative of three independent experiments.
Figure 8
Figure 8. The complex IL-15/IL-15R alpha induced by P31-43 on the surface of CaCo-2 cells functions as a growth factor for CTLL2 cells.
3H-thymidine incorporation by CTLL2 cells induced to proliferate by CaCo-2 cells untreated or treated with P31-43 or P31-43 and anti-IL-15 or P57-68 was measured. CaCo-2 and CTLL2 cells were co-cultivated overnight. Data are expressed as 3H-TdR (CpM 1×10 6 cells). Columns represent the mean, and bars represent the standard deviation of five independent experiments. *p<0.05 (Student's t-test). For methods, see supplementary material.
Figure 9
Figure 9. P31-43 alters trafficking of IL-15-containing recycling vesicles and increases recycling markers expressed on CaCo-2 cell surfaces.
(A) IL-15-EGFP and Transferrin-Tex Red accumulate and co-localise after P31-43 treatment in a recycling vesicular compartment. IL-15-EGFP was transfected into CaCo-2 cells and observed by microscope after treatment with Transferrin-Tex Red and P31-43. White lines show the area of a single cell. (63x objective and 2x zoom). IL-15-EGFP (green) co-localises with Transferrin-Tex-Red (red) positive vesicles. Merge of the red and green panels is shown with yellow/orange colour indicating co-localisation. The co-localisation coefficient was calculated as reported under “Methods”. The results are representative of three independent experiments. For methods, see supplementary material. (B) Statistical analysis of fluorescence intensity/cell. For treated and untreated samples, three independent experiments were done, measuring fluorescence intensity of 10 cells in random fields in each experiment. ** = p<0.01, *** = p<0.001 (Student t-test). For methods, see supplementary material.
Figure 10
Figure 10. P31-43 increases expression of recycling marker transferrin receptor on the cell surface.
A) FACS analysis of transferrin receptor, one experiment is shown. B) Statistical analysis of CaCo-2 cells percentage expressing the recycling marker, Transferrin Receptor, on the cell surface after P31-43 or P57-68 O/N treatment. Columns represent means and bars are the standard deviations of ten independent experiments. *p<0.05 (Student's t test). C) Confocal images of transferrin receptor expression on CaCo-2 cell surfaces. White arrows point to cell surface. 63x objective.

References

    1. Sollid LM. Molecular basis of celiac disease. Annu Rev Immunol. 2000;2000;18:53–81. - PubMed
    1. Maiuri L, Ciacci C, Ricciardelli I, Vacca L, Raia V, et al. Association between innate response to gliadin and activation of pathogenic T cells in coeliac disease. Lancet. 2003;362:30–37. - PubMed
    1. Hue S, Mention JJ, Monteiro RC, Zhang S, Cellier C, et al. A direct role for NKG2D/MICA interaction in villous atrophy during celiac disease. Immunity. 2004;21:367–77. - PubMed
    1. Marsh MN. Clinical and pathological spectrum of coeliac disease. Gut. 1993;34:1740; author reply 1. - PMC - PubMed
    1. Marsh MN, Crowe PT. Morphology of the mucosal lesion in gluten sensitivity. Baillieres Clin Gastroenterol. 1995;9:273–93. - PubMed

Publication types

MeSH terms