Clinical Trial
. 2011 Feb 22;6(2):e17059.
doi: 10.1371/journal.pone.0017059.

Neuromuscular consequences of an extreme mountain ultra-marathon

Affiliations
Clinical Trial

Neuromuscular consequences of an extreme mountain ultra-marathon

Guillaume Y Millet et al. PLoS One. .

Abstract

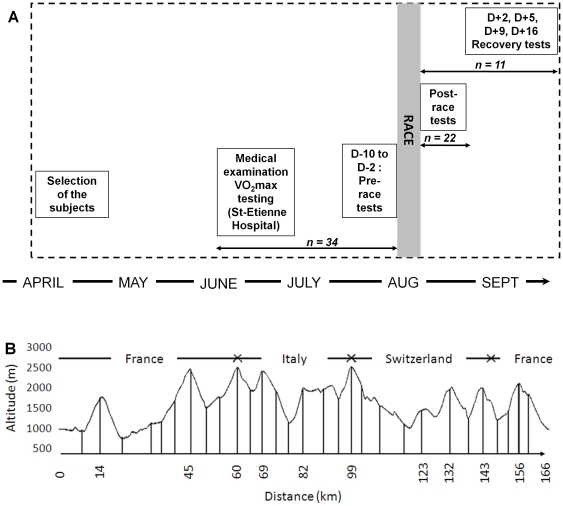
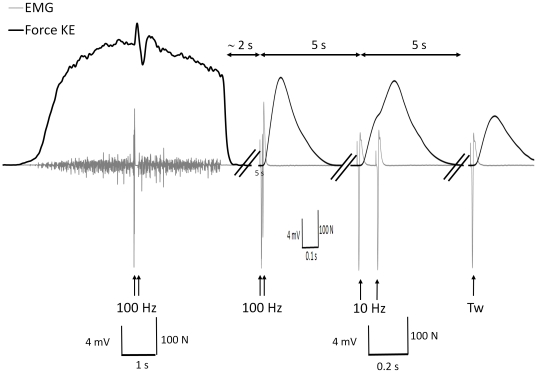
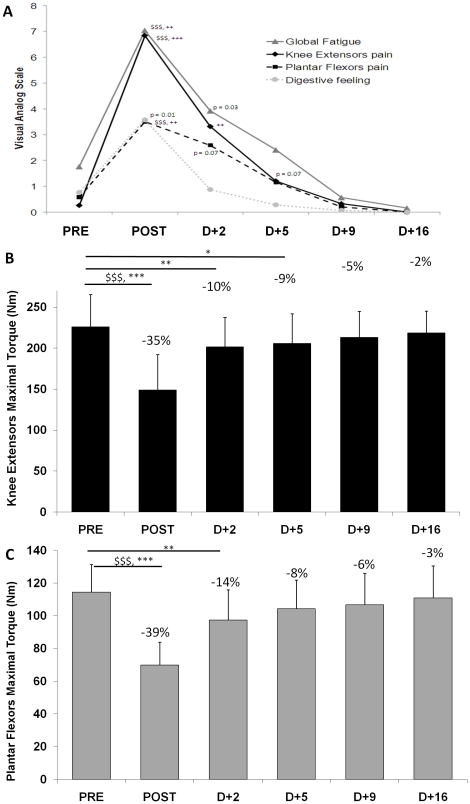
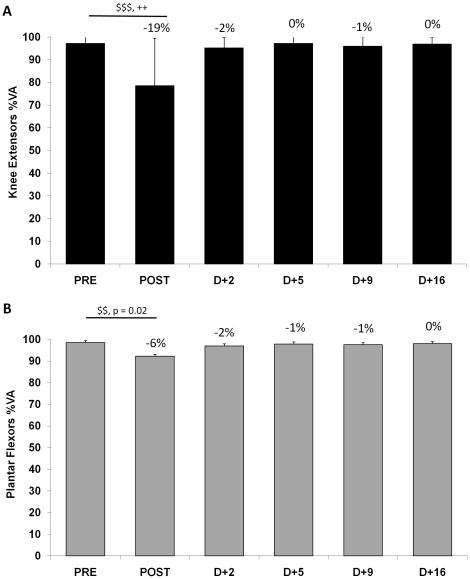
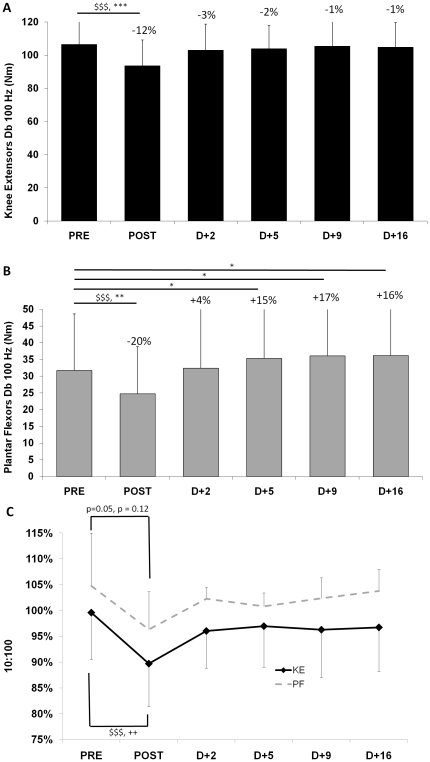
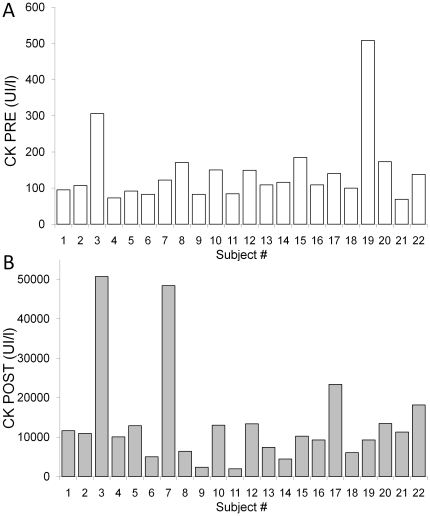
We investigated the physiological consequences of one of the most extreme exercises realized by humans in race conditions: a 166-km mountain ultra-marathon (MUM) with 9500 m of positive and negative elevation change. For this purpose, (i) the fatigue induced by the MUM and (ii) the recovery processes over two weeks were assessed. Evaluation of neuromuscular function (NMF) and blood markers of muscle damage and inflammation were performed before and immediately following (n = 22), and 2, 5, 9 and 16 days after the MUM (n = 11) in experienced ultra-marathon runners. Large maximal voluntary contraction decreases occurred after MUM (-35% [95% CI: -28 to -42%] and -39% [95% CI: -32 to -46%] for KE and PF, respectively), with alteration of maximal voluntary activation, mainly for KE (-19% [95% CI: -7 to -32%]). Significant modifications in markers of muscle damage and inflammation were observed after the MUM as suggested by the large changes in creatine kinase (from 144 ± 94 to 13,633 ± 12,626 UI L(-1)), myoglobin (from 32 ± 22 to 1,432 ± 1,209 µg L(-1)), and C-Reactive Protein (from <2.0 to 37.7 ± 26.5 mg L(-1)). Moderate to large reductions in maximal compound muscle action potential amplitude, high-frequency doublet force, and low frequency fatigue (index of excitation-contraction coupling alteration) were also observed for both muscle groups. Sixteen days after MUM, NMF had returned to initial values, with most of the recovery process occurring within 9 days of the race. These findings suggest that the large alterations in NMF after an ultra-marathon race are multi-factorial, including failure of excitation-contraction coupling, which has never been described after prolonged running. It is also concluded that as early as two weeks after such an extreme running exercise, maximal force capacities have returned to baseline.


Conflict of interest statement

Competing Interests: The authors have declared that no competing interests exist.

Figures

Figure 1
Figure 1. General view of the experiment and race profile.
General view of the experimental testing (panel A) and the course of the race supporting the study (panel B).
Figure 2
Figure 2. Typical torque and EMG traces during voluntary and electrically evoked contractions.
Typical torque trace (black line) during the knee extensor maximal voluntary contraction and determination of maximal activation level, as well as high- and low frequency doublets (100 Hz and 10 Hz, respectively) and single twitch, after the mountain ultra-marathon. The black arrows indicate the timing of delivery of the stimuli. EMG is represented with a grey line.
Figure 3
Figure 3. Self-reported general fatigue and maximal voluntary contraction on the knee extensor and plantar flexor muscles.
Self-reported general fatigue, knee extensors (KE) and plantar flexors (PF) pain and digestive system sensations (panel A) as well as maximal voluntary contraction (MVC) on the knee extensor muscles (panel B) and on the plantar flexor muscles (panel C) before (PRE), after (POST) and 2, 5, 9 and 16 days after the race (D+2, D+5, D+9 and D+16, respectively). Data are mean values ± SD. $$$: P<0.001, Significance of t-test between PRE and POST (n = 22). ++: P<0.01; +++: P<0.001, Significance level of pairwise comparisons between PRE and every other measurements (n = 11) revealed by Wilcoxon test plus Bonferroni corrections when Friedman ANOVA was significant, P<0.01 to be significant. *: P<0.05; **: P<0.01; ***: P<0.001, Significance level of pairwise comparisons between PRE and every other measurements (n = 11) revealed by post-hoc analysis. Percentages indicated are for n = 11.
Figure 4
Figure 4. Maximal voluntary activation on the knee extensor and plantar flexor muscles.
Maximal voluntary activation (%VA) of the knee extensor muscles (panel A) and the plantar flexor muscles (panel B) before (PRE), after (POST) and 2, 5, 9 and 16 days after the race (D+2, D+5, D+9 and D+16, respectively). Data are mean values ± SD. $$$: P<0.001, Significance of Wilcoxon test between PRE and POST (n = 22). ++: P<0.01: Significance level of pairwise comparisons between PRE and every other measurements (n = 11) revealed by Wilcoxon test plus Bonferroni corrections when Friedman ANOVA was significant, P<0.01 to be significant. Percentages indicated are for n = 11.
Figure 5
Figure 5. Mechanical responses to the high-frequency doublets and to the low-to-high frequency doublet ratio.
Maximal high frequency doublet (Db 100 Hz) on the knee extensor muscles (panel A) and the plantar flexor muscles (panel B) as well as the low- to high-frequency doublet ratio (10∶100 ratio, panel C) before (PRE), after (POST) and 2, 5, 9 and 16 days after the race (D+2, D+5, D+9 and D+16, respectively). Data are mean values ± SD. Panels A and B: $$$: P<0.001, Significance of t-test between PRE and POST (n = 22). *: P<0.05; **: P<0.01; ***: P<0.001, Significance level of pairwise comparisons between PRE and every other measurements (n = 11) revealed by post-hoc analysis, are indicated by horizontal brackets). Panel C: $$$: P<0.001, Significance of Wilcoxon test between PRE and POST (n = 22). ++: P<0.01, Significance level of pairwise comparisons between PRE and every other measurements (n = 11) revealed by Wilcoxon test plus Bonferroni corrections when Friedman ANOVA was significant. Percentages indicated are for n = 11.
Figure 6
Figure 6. Individual creatine kinase activities.
Individual creatine kinase activities (CK) before (PRE, panel A) and after (POST, panel B) the mountain ultra-marathon. Note the different scale.

References

    1. Hoffman MD, Ong JC, Wang G. Historical analysis of participation in 161-km ultramarathons in North America. Int J History Sport. 2010;27:1877–1891. - PubMed
    1. Martin V, Kerhervé H, Messonnier LA, Banfi JC, Geyssant A, et al. Central and peripheral contributions to neuromuscular fatigue induced by a 24-h treadmill run. J Appl Physiol. 2010;108:1224–1233. - PubMed
    1. Pearson H. Physiology: freaks of nature? Nature. 2006;444:1000–1001. - PubMed
    1. Enoka RM, Stuart DG. Neurobiology of muscle fatigue. J Appl Physiol. 1992;72:1631–1648. - PubMed
    1. Millet GY, Lepers R. Alterations of neuromuscular function after prolonged running, cycling and skiing exercises. Sports Med. 2004;34:105–116. - PubMed

Publication types