Comparative Study
. 2011 Jul;21(7):783-801.
doi: 10.1002/hipo.20929. Epub 2011 Mar 1.

The influence of objects on place field expression and size in distal hippocampal CA1

Affiliations
Comparative Study

The influence of objects on place field expression and size in distal hippocampal CA1

Sara N Burke et al. Hippocampus. 2011 Jul.

Abstract

The perirhinal and lateral entorhinal cortices send prominent projections to the portion of the hippocampal CA1 subfield closest to the subiculum, but relatively little is known regarding the contributions of these cortical areas to hippocampal activity patterns. The anatomical connections of the lateral entorhinal and perirhinal cortices, as well as lesion data, suggest that these brain regions may contribute to the perception of complex stimuli such as objects. The current experiments investigated the degree to which three-dimensional objects affect place field size and activity within the distal region (closest to the subiculum) of CA1. The activity of CA1 pyramidal cells was monitored as rats traversed a circular track that contained no objects in some conditions and three-dimensional objects in other conditions. In the area of CA1 that receives direct lateral entorhinal input, three factors differentiated the objects-on-track conditions from the no-object conditions: more pyramidal cells expressed place fields when objects were present, adding or removing objects from the environment led to partial remapping in CA1, and the size of place fields decreased when objects were present. In addition, a proportion of place fields remapped under conditions in which the object locations were shuffled, which suggests that at least some of the CA1 neurons' firing patterns were sensitive to a particular object in a particular location. Together, these data suggest that the activity characteristics of neurons in the areas of CA1 receiving direct input from the perirhinal and lateral entorhinal cortices are modulated by non-spatial sensory input such as three-dimensional objects. © 2011 Wiley-Liss, Inc.


Figures

Figure 1
Figure 1. Behavioral procedures used for electrophysiological recordings
The track used for behavior during all electrophysiological recordings. Rats were required to run 20 laps bi-directionally (10 counterclockwise, 10 clockwise) for a food reward. (A) Rewards were given in two food dishes located on opposite sides of a barrier (indicated by squares), at the position where the rat was required to turn around. The “X” indicates the location of the pot that the rat was placed in during rest episodes. (B) Examples of behavioral procedures where objects were placed on the track. Numbers indicate the approximate positions of the different objects. In the “objects-both epochs” condition, 8 novel objects were placed at discrete locations around the track for the first epoch of behavior (top panel), and the rat had to run past the objects to obtain the food reward. During the second epoch of behavior (bottom panel), 6 of the 8 objects used in epoch 1 were placed on the track at the same location as in epoch 1, while 2 of the 8 objects were removed and substituted with 2 novel objects (in this case objects 3 and 5 were replaced with objects 9 and 10 as indicated by the grey boxes). The “configuration change” condition occurred on the day following the objects-both epochs condition. For this behavioral procedure, the same objects used in epoch 1 from the previous day were again placed on the track at the same location as in epoch 1, and the rat ran 20 laps (top panel). During the second epoch of track-running, the positions of the eight familiar objects were pseudo-randomly shuffled such that no object was at the same position between epoch 1 and 2 (bottom panel).
Figure 2
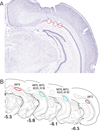
Figure 2. Tetrode tract reconstructions for the intermediate portion of CA1 close to the subiculum border (“distal CA1”)
(A) A nissl stained coronal section of the right hemishere of a rat that participated in the current experiment. This section is approximately −5.3 mm posterior to bregma and shows 3 tracks, made by the tetrode recording probes, that reached the pyramidal cell layer (circles) of the distal region of intermediate CA1 in rat 8879. (B) The areas of distal CA1 from which pyramidal neuron recordings were obtained. The ovals show the regions where marker lesions were observed following histological verification (Figure adapted from Paxinos and Watson, 1998). The CA1 regions where recordings were obtained for each rat are indicated by the rat number.
Figure 3
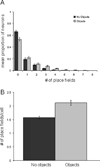
Figure 3. Place field expression across behavioral conditions
(A) The proportion of cells in intermediate CA1 with n = 0,1,2,3,4,5,6,7 or 8 place fields when there were no objects on the track (black) versus conditions with objects on the track (grey). A significantly larger proportion of intermediate CA1 cells expressed place fields during track running conditions with objects (F[3,2] = 9.65, p < 0.01). (B) The mean and standard error (SEM) for the number of place fields per active neuron during track-running epochs with no objects (black) versus the conditions with objects (grey). The CA1 neurons that showed a significant firing rate increase during the track running epochs expressed significantly more place fields within an epoch of behavior when objects were placed on the track relative to when the track was empty (F[3,2] = 4.56, p < 0.03; repeated-measures ANOVA). All place fields were determined using the phase precession definition (Maurer et al., 2006a).
Figure 4
Figure 4. The effect of objects on place field expression in single CA1 neurons
Representative examples of the activity of single CA1 neurons between object and no object epochs. In both (A) and (B) the X axes are position on the track (cm) relative to the barrier, which is at position 0 and −335. The rat was running from left to right, and the negative values for position indicate that the animal’s heading was in the counterclockwise direction. The top panels show the occupancy normalized firing rate histograms and the bottom panels are raster plots of spikes by lap. Finally, the black asterisks indicate the positions of the objects. (A) In this example there were no objects on the track during epoch 1 (left panel), and then objects were placed on the track for epoch 2 (right panel). This neuron only had place field activity near the food dish (far left area) in the absence of objects. When objects were added to the track, however, the cell expressed three place fields. (B) A representative example of the activity of a CA1 neuron when objects were on the track during epoch 1 (left panel) but the objects were removed for epoch 2 (right panel). In this example, the neuron was active at three discrete locations and near the food dish when objects were present. When the objects were removed, however, only one of the three regions of high firing near objects remained.
Figure 5
Figure 5. The effect of objects on inter-epoch global remapping in CA1
Frequency distribution of activity correlations (r) between epoch 1 and epoch 2 for CA1 neurons in the (A) no objects, both epochs, (B) objects, both epochs, (C) configuration change, (D) no objects-objects, and (E) objects-no objects conditions. Each distribution was normalized by the number of neurons recorded during a given condition. (F) Mean r value for the five different behavioral conditions. The between epoch activity patterns of CA1 place fields for behavioral procedures where the treatment was the same for both epochs was significantly more correlated compared to when the procedures changed between epochs (#; T[3] = 3.60, p < 0.05; paired-samples T test). The configuration change condition showed an intermediate r value between the “no change” and “change” conditions. Moreover this condition was significantly less correlated across epochs of track running than the objects, both epochs condition (*T[3] = 5.61; p < 0.05; Tukey HSD).
Figure 6
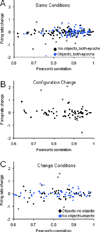
Figure 6. No evidence for rate-remapping in CA1 pyramidal cell activity between epochs 1 and 2
For a single neuron to demonstrate ‘rate-remapping’ between epochs 1 and 2, both the between epoch correlation coefficient and firing rate change should be high. This would be indicative of a cell that showed activity at the same location but changed its rate to represent an alteration to the environment (Leutgeb et al., 2005b). The difference in firing rate between epochs for every pyramidal cell with a least one place field in either epoch plotted against the neuron’s Pearson’s correlation coefficient for CA1 cells that did not show global remapping (r > 0.6) in the (A) Same conditions (no objects, both epochs and Objects, both epochs) (B) Configuration change, and (C) Change conditions (No objects-objects and Objects-no objects conditions). In all plots, cells with a between epoch firing rate change at least 2 standard deviations from the mean rate change for all cells are indicated by the open circles. In all conditions less than 9% of CA1 neurons with stable place fields between epochs showed a significant firing rate change. Moreover, the rate change between epochs 1 and 2 was not significantly different between any of the behavioral conditions (F[3,4] = 3.92, p = 0.11; repeated-measures ANOVA).
Figure 7
Figure 7. Representative examples of activity for CA1 neurons recorded during epoch 1
In both (A) and (B), the X-axes are the linearized position on the track relative to the barrier (in cm), the rat was running from left to right, and the negative values indicate that the rat’s heading was counterclockwise. The top panels are the firing rate histograms for both cells, and the bottom panels are the raster plot of spikes by lap. (A) One cell was recorded when there were no objects on the track, (B) while the other neuron was recorded from the same rat on a different day when objects were placed on the track during epoch1. In (B) the asterisks indicate the position of objects.
Figure 8
Figure 8. The effect of objects on place field size
(A) The mean size of place fields for behavioral procedures with no objects on the track (black) versus conditions with objects (grey). The presence of objects on the track significantly reduced the mean size of place fields (T[3] = 5.68, p < 0.01; paired-samples T-test). Error bars represent +/− one standard error of the mean. (B) The frequency distribution of place field size when rats traversed an empty track (black) versus when the track had objects on it (grey). Both frequency distributions were normalized by the total number of place fields in each condition and smoothed with a hanning window of 5. Although the range of place field size is similar between groups, when the track was enriched with objects a larger proportion of place fields were small and there was a reduction in the number of large place fields.
Figure 9
Figure 9. Place field size is stable when objects are not added or removed
The magnitude of the difference in place field size between epochs 1 and 2. Adding or removing objects from the track between the two epochs of track running significantly changed the size of place fields (T[3] = 6.14, p < 0.05; paired-samples T test). For the behavioral procedures where both epochs had objects on the track or both epochs did not have objects on the track, there was no significant difference in place field size between epochs (F[1,3] = 4.52, p = 0.12; repeated-measures ANOVA). Error bars represent +/− one standard error of the mean.
Figure 10
Figure 10. The slope and dispersion of theta phase precession in the no objects and objects conditions
(A) Representative examples of theta phase by position plots for two neurons recorded from the same rat. In both panels the X axes are the position on the track normalized by the center of mass of the spikes, and the Y axes are theta phase normalized so that the peak phase is 360. The left panel shows the activity of a cell during a no object condition and the right panel is the activity of a cell from an object condition. The Pearson’s correlation coefficient of phase by position is indicated for each cell, and the black lines represent the least-squares line of best fit. (B) The mean slope of theta phase as a function of distance (i.e., the rate of phase precession) for the no objects (black) and the objects (grey) conditions. The rate of phase precession was significantly greater in the objects conditions (T[3] = 6.94, p < 0.01; paired-samples T test), which is consistent with the smaller field size. (C) The dispersion of theta phase precession, as measured by the Pearson’s correlation of the phase versus distance plots, was not different in the no objects (black) and objects (grey) conditions (Figure 11B; T[3] = 0.59, p = 0.60; paired-samples T test). This indicates that the relationship between phase and position was not affected by the objects. Error bars represent +/− one standard error of the mean.
Figure 11
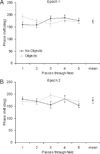
Figure 11. Objects on the track did not impede rats from running through the centers of place fields
The mean phase difference between the first spike and the last spike fired (i.e., total phase shift) for the first 5 passes through a place field during epoch 1 (A) and epoch 2 (B). A decrease in the total phase shift would indicate that a rat was not running through the place field centers. There was not a significant difference in the phase shift between the no objects (black) and objects (grey) conditions (T[3] = 0.61, p = 0.55; paired-sample T test), suggesting that in both conditions rats were traversing the centers of place fields. Error bars represent +/− one standard error of the mean.
Figure 12
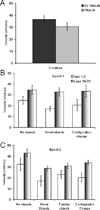
Figure 12. Running velocity during the different behavioral conditions
(A) The mean running velocity for conditions without objects (black) and conditions with objects (grey). The rats’ running velocities when objects were on the track were not significantly different compared to the no object conditions (T[3] = 1.48, p = 0.24; student’s T test). (B) The mean running velocity during epoch 1 for laps 1–2 (unfilled) and laps 19–20 (filled) for conditions with no objects, conditions with novel objects, and the configuration change condition. (C) The mean running velocity during epoch 2 for laps 1–2 (unfilled) and laps 19–20 (filled) for conditions with no objects, conditions with novel objects, conditions with familiar objects, and the configuration change condition. For all behavioral conditions, when both epochs were analyzed together, the rats ran significantly more slowly during laps 1–2 relative to laps 19–20 (F[1,22] = 32.80, p < 0.001). Individual post hoc comparisons indicated that the difference in running velocity between the first two laps and last two laps was for epochs with novel objects (epoch 1 of the objects, both epochs condition; epoch 1 of the objects-no objects condition; epoch 2 of the no objects-objects condition; p < 0.05 for all comparisons). Additionally, the rats’ running velocity was significantly slower during laps 1–2 relative to laps 19–20 for epoch 2 of the configuration change where familiar objects were placed in a novel spatial arrangement (p < 0.05).

Similar articles

Cited by

References

    1. Amaral D, Witter M. Hippocampal Formation. In: G P, editor. The Rat Nervous System. 2nd ed. San Diego: Academic Press; 1995. pp. 443–486.
    1. Battaglia FP, Sutherland GR, McNaughton BL. Local sensory cues and place cell directionality: additional evidence of prospective coding in the hippocampus. J Neurosci. 2004;24(19):4541–4550. - PMC - PubMed
    1. Brown JE, Skaggs WE. Concordant and discordant coding of spatial location in populations of hippocampal CA1 pyramidal cells. J Neurophysiol. 2002;88(4):1605–1613. - PubMed
    1. Brun VH, Leutgeb S, Wu HQ, Schwarcz R, Witter MP, Moser EI, Moser MB. Impaired spatial representation in CA1 after lesion of direct input from entorhinal cortex. Neuron. 2008;57(2):290–302. - PubMed
    1. Burgess N, O'Keefe J. Neuronal computations underlying the firing of place cells and their role in navigation. Hippocampus. 1996;6(6):749–762. - PubMed

Publication types