. 2012 Jan;33(1):89-104.
doi: 10.1002/hbm.21197. Epub 2011 Mar 1.

Functional networks for cognitive control in a stop signal task: independent component analysis

Affiliations

Functional networks for cognitive control in a stop signal task: independent component analysis

Sheng Zhang et al. Hum Brain Mapp. 2012 Jan.

Abstract

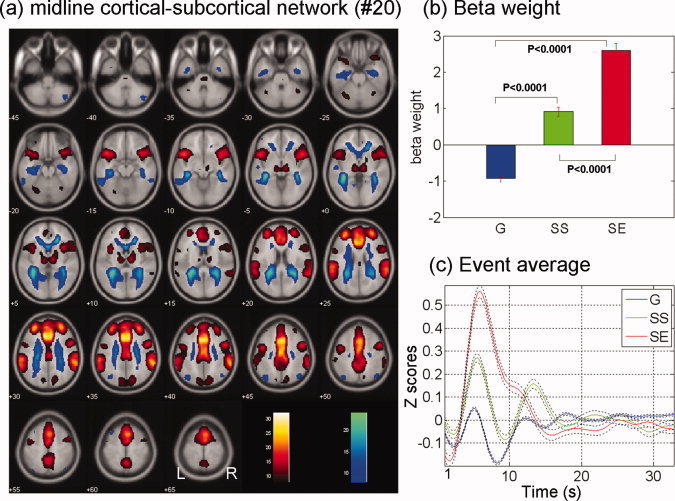
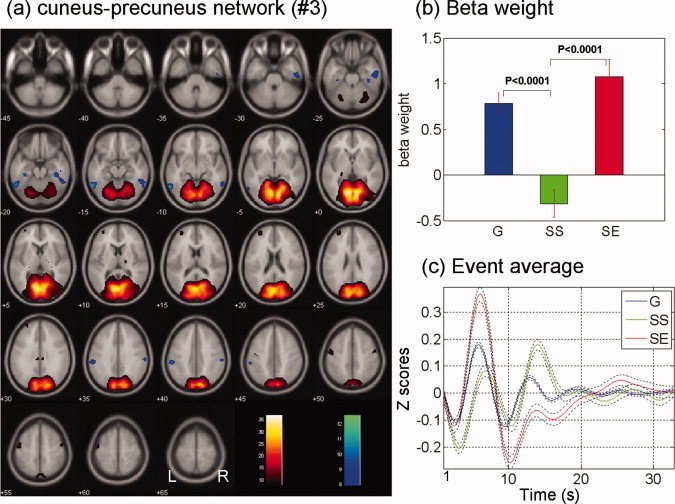
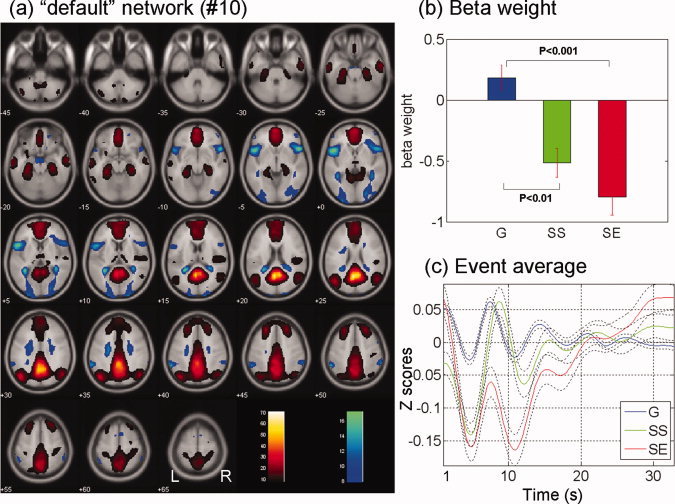
Cognitive control is a critical executive function of the human brain. Many studies have combined general linear modeling and the stop signal task (SST) to delineate the component processes of cognitive control. For instance, by contrasting stop success (SS) and stop error (SE) trials in the SST, investigators examined the neural processes underlying stop signal inhibition (SS > SE) and error processing (SE > SS). To complement this parameterized approach, here, we employed a data-driven method--independent component analysis (ICA)--to elucidate neural networks and the relationship between neural networks subserving cognitive control. In 59 adults performing the SST during fMRI, we characterized six independent components with ICA. These functional networks, temporally sorted for go success, SS, and SE trials as the events of interest, included a motor cortical network for motor preparation and execution; a right fronto-parietal network for attentional monitoring; a left fronto-parietal network for response inhibition; a midline cortico-subcortical network for error processing; a cuneus-precuneus network for behavioral engagement; and a "default" network for self-referential processing. Across subjects the event-associated weights of these functional networks showed a distinct pattern of correlation. These results provide new insight into the component processes of cognitive control.


Figures

Figure 1
Figure 1
(a) Motor cortical network (no. 11) identified from ICA, with regions with positive (warm color) and negative (cool color) signal change. Regions shown are thresholded at P < 0.000001 (n = 59), corrected for familywise error (FWE) of multiple comparisons. (b) and (c) show the beta weights and event averages of G, SS, and SE trials for this component network. [Color figure can be viewed in the online issue, which is available at wileyonlinelibrary.com.]
Figure 2
Figure 2
(a) Right fronto‐parietal network (no. 4) identified from ICA, with regions with positive (warm color) and negative (cool color) signal change. Regions shown are thresholded at P < 0.000001 (n = 59), corrected for FWE of multiple comparisons. (b) and (c) show the beta weights and event averages of G, SS, and SE trials for this component network. [Color figure can be viewed in the online issue, which is available at wileyonlinelibrary.com.]
Figure 3
Figure 3
(a) Left fronto‐parietal network (no. 8) identified from ICA, with regions with positive (warm color) and negative (cool color) signal change. Regions shown are thresholded at P < 0.000001 (n = 59), corrected for FWE of multiple comparisons. (b) and (c) show the beta weights and event averages of G, SS, and SE trials for this component network. [Color figure can be viewed in the online issue, which is available at wileyonlinelibrary.com.]
Figure 4
Figure 4
(a) Midline cortico‐subcortical network (no. 20) identified from ICA, with regions with positive (warm color) and negative (cool color) signal change. Regions shown are thresholded at P < 0.000001 (n = 59), corrected for FWE of multiple comparisons. (b) and (c) show the beta weights and event averages of G, SS, and SE trials for this component network. [Color figure can be viewed in the online issue, which is available at wileyonlinelibrary.com.]
Figure 5
Figure 5
(a) Cuneus–precuneus network (no. 3) identified from ICA, with regions with positive (warm color) and negative (cool color) signal change. Regions shown are thresholded at P < 0.000001 (n = 59), corrected for FWE of multiple comparisons. (b) and (c) show the beta weights and event averages of G, SS, and SE trials for this component network. [Color figure can be viewed in the online issue, which is available at wileyonlinelibrary.com.]
Figure 6
Figure 6
(a) Default network (no. 10) identified from ICA, with regions with positive (warm color) and negative (cool color) signal change. Regions shown are thresholded at P < 0.000001 (n = 59), corrected for FWE of multiple comparisons. (b) and (c) show the beta weights and event averages of G, SS, and SE trials for this component network. [Color figure can be viewed in the online issue, which is available at wileyonlinelibrary.com.]
Figure 7
Figure 7
Pairwise linear regressions across all 59 subjects between beta weights of different components and different trial types. Correlations that were significant at P < 0.01 uncorrected were highlighted here with * denoting those with a P < 0.001 and ** those with a P < 0.0001, uncorrected. Red line and blue line indicate a positive and negative correlation, respectively. The numbers on the lines are the R values of linear regression. Supporting Information Tables 3–8 list the R and P values of all correlations. [Color figure can be viewed in the online issue, which is available at wileyonlinelibrary.com.]
Figure 8
Figure 8
Group ICA analysis under current version of GIFT using intensity normalization, GICA3, and centering. [Color figure can be viewed in the online issue, which is available at wileyonlinelibrary.com.]

References

    1. Andersson JL, Hutton C, Ashburner J, Turner R, Friston K ( 2001): Modeling geometric deformations in EPI time series. Neuroimage 13: 903–119. - PubMed
    1. Andrews‐Hanna JR, Reidler JS, Sepulcre J, Poulin R, Buckner RL ( 2010): Functional–anatomic fractionation of the brain's default network. Neuron 65: 550–562. - PMC - PubMed
    1. Aron AR, Poldrack RA ( 2006): Cortical and subcortical contributions to Stop signal response inhibition: role of the subthalamic nucleus. J Neurosci 26: 2424–2433. - PMC - PubMed
    1. Aron AR, Fletcher PC, Bullmore ET, Sahakian BJ, Robbins TW ( 2003): Stop‐signal inhibition disrupted by damage to right inferior frontal gyrus in humans. Nat Neurosci 6: 115–116. - PubMed
    1. Ashburner J, Friston KJ ( 1999): Nonlinear spatial normalization using basis functions. Hum Brain Mapp 7: 254–266. - PMC - PubMed

Publication types

LinkOut - more resources