Analyses of cerebral microdialysis in patients with traumatic brain injury: relations to intracranial pressure, cerebral perfusion pressure and catheter placement
- PMID: 21366904
- PMCID: PMC3056807
- DOI: 10.1186/1741-7015-9-21
Analyses of cerebral microdialysis in patients with traumatic brain injury: relations to intracranial pressure, cerebral perfusion pressure and catheter placement
Abstract
Background: Cerebral microdialysis (MD) is used to monitor local brain chemistry of patients with traumatic brain injury (TBI). Despite an extensive literature on cerebral MD in the clinical setting, it remains unclear how individual levels of real-time MD data are to be interpreted. Intracranial pressure (ICP) and cerebral perfusion pressure (CPP) are important continuous brain monitors in neurointensive care. They are used as surrogate monitors of cerebral blood flow and have an established relation to outcome. The purpose of this study was to investigate the relations between MD parameters and ICP and/or CPP in patients with TBI.
Methods: Cerebral MD, ICP and CPP were monitored in 90 patients with TBI. Data were extensively analyzed, using over 7,350 samples of complete (hourly) MD data sets (glucose, lactate, pyruvate and glycerol) to seek representations of ICP, CPP and MD that were best correlated. MD catheter positions were located on computed tomography scans as pericontusional or nonpericontusional. MD markers were analyzed for correlations to ICP and CPP using time series regression analysis, mixed effects models and nonlinear (artificial neural networks) computer-based pattern recognition methods.
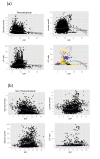
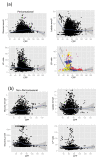
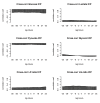
Results: Despite much data indicating highly perturbed metabolism, MD shows weak correlations to ICP and CPP. In contrast, the autocorrelation of MD is high for all markers, even at up to 30 future hours. Consequently, subject identity alone explains 52% to 75% of MD marker variance. This indicates that the dominant metabolic processes monitored with MD are long-term, spanning days or longer. In comparison, short-term (differenced or Δ) changes of MD vs. CPP are significantly correlated in pericontusional locations, but with less than 1% explained variance. Moreover, CPP and ICP were significantly related to outcome based on Glasgow Outcome Scale scores, while no significant relations were found between outcome and MD.
Conclusions: The multitude of highly perturbed local chemistry seen with MD in patients with TBI predominately represents long-term metabolic patterns and is weakly correlated to ICP and CPP. This suggests that disturbances other than pressure and/or flow have a dominant influence on MD levels in patients with TBI.
Figures


Similar articles
-
Interaction between brain chemistry and physiology after traumatic brain injury: impact of autoregulation and microdialysis catheter location.J Neurotrauma. 2011 Jun;28(6):849-60. doi: 10.1089/neu.2010.1656. J Neurotrauma. 2011. PMID: 21488707 Free PMC article.
-
The neurological wake-up test does not alter cerebral energy metabolism and oxygenation in patients with severe traumatic brain injury.Neurocrit Care. 2014 Jun;20(3):413-26. doi: 10.1007/s12028-013-9876-4. Neurocrit Care. 2014. PMID: 23934408
-
Cerebral microdialysis of patients with severe traumatic brain injury exhibits highly individualistic patterns as visualized by cluster analysis with self-organizing maps.Crit Care Med. 2004 Dec;32(12):2428-36. doi: 10.1097/01.ccm.0000147688.08813.9c. Crit Care Med. 2004. PMID: 15599147
-
[Use of intracerebral microdialysis in severe traumatic brain injury].No Shinkei Geka. 2010 Sep;38(9):795-809. No Shinkei Geka. 2010. PMID: 20864768 Review. Japanese.
-
Mortality and Outcome Comparison Between Brain Tissue Oxygen Combined with Intracranial Pressure/Cerebral Perfusion Pressure-Guided Therapy and Intracranial Pressure/Cerebral Perfusion Pressure-Guided Therapy in Traumatic Brain Injury: A Meta-Analysis.World Neurosurg. 2017 Apr;100:118-127. doi: 10.1016/j.wneu.2016.12.097. Epub 2017 Jan 3. World Neurosurg. 2017. PMID: 28057593 Review.
Cited by
-
Microdialysis Monitoring in Clinical Traumatic Brain Injury and Its Role in Neuroprotective Drug Development.AAPS J. 2017 Mar;19(2):367-376. doi: 10.1208/s12248-016-0027-7. Epub 2017 Jan 9. AAPS J. 2017. PMID: 28070712 Review.
-
Current state of high-fidelity multimodal monitoring in traumatic brain injury.Acta Neurochir (Wien). 2022 Dec;164(12):3091-3100. doi: 10.1007/s00701-022-05383-8. Epub 2022 Oct 19. Acta Neurochir (Wien). 2022. PMID: 36260235 Free PMC article. Review.
-
Time-Dependent Changes in the Biofluid Levels of Neural Injury Markers in Severe Traumatic Brain Injury Patients-Cerebrospinal Fluid and Cerebral Microdialysates: A Longitudinal Prospective Pilot Study.Neurotrauma Rep. 2023 Mar 1;4(1):107-117. doi: 10.1089/neur.2022.0076. eCollection 2023. Neurotrauma Rep. 2023. PMID: 36895820 Free PMC article.
-
Technical notes on the placement of cerebral microdialysis: A single center experience.Front Neurol. 2023 Jan 9;13:1041952. doi: 10.3389/fneur.2022.1041952. eCollection 2022. Front Neurol. 2023. PMID: 36698903 Free PMC article.
-
Update on multimodality monitoring.Curr Neurol Neurosci Rep. 2012 Aug;12(4):474-80. doi: 10.1007/s11910-012-0274-7. Curr Neurol Neurosci Rep. 2012. PMID: 22527682 Review.
References
Publication types
MeSH terms
LinkOut - more resources
Full Text Sources
Medical

