Comparative Study
. 2011 Mar 2;31(9):3197-206.
doi: 10.1523/JNEUROSCI.4219-10.2011.

Disc1 point mutations in mice affect development of the cerebral cortex

Affiliations
Comparative Study

Disc1 point mutations in mice affect development of the cerebral cortex

Frankie H F Lee et al. J Neurosci. .

Abstract

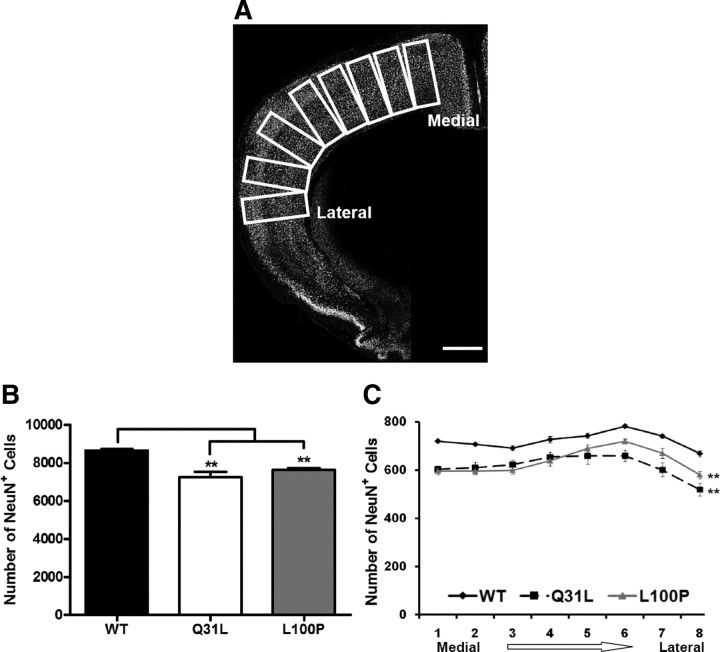
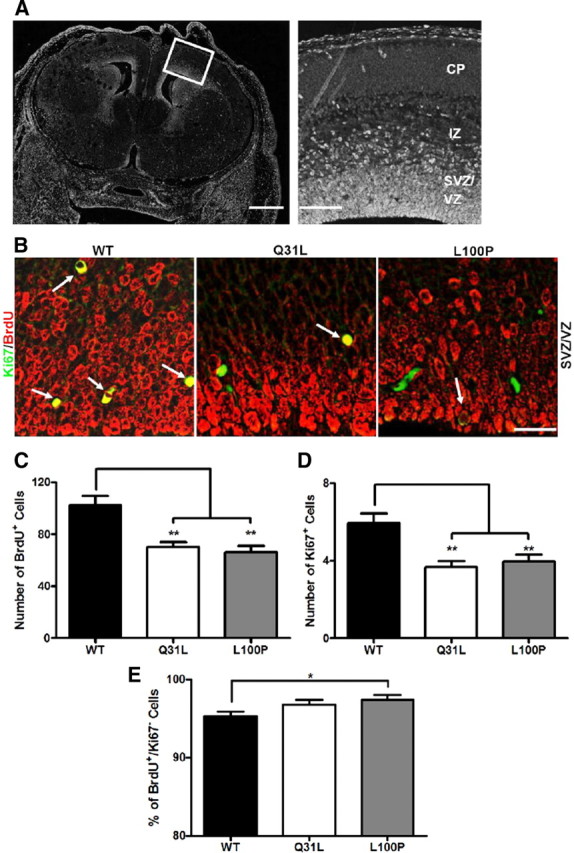
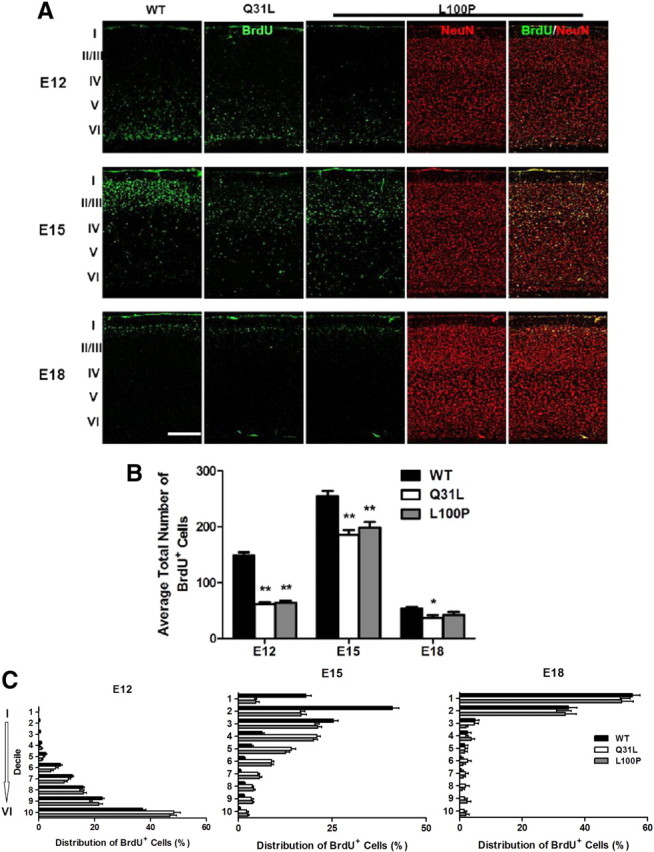
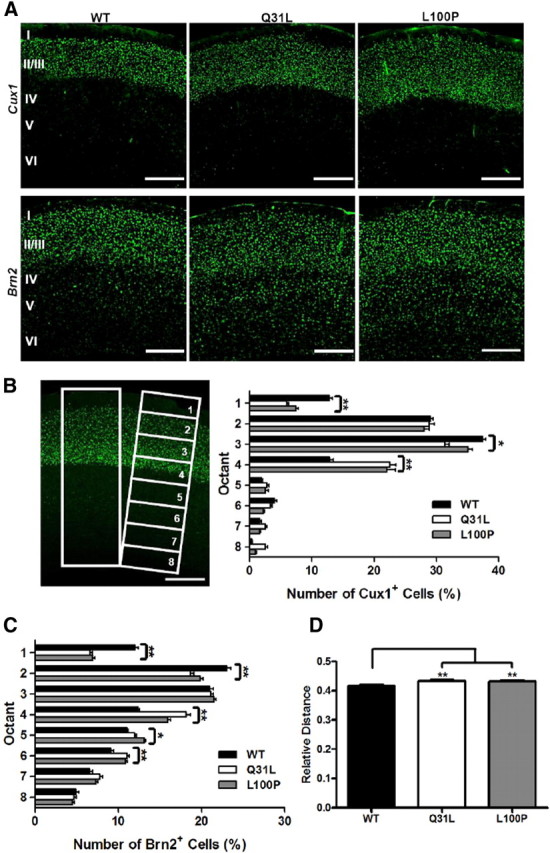
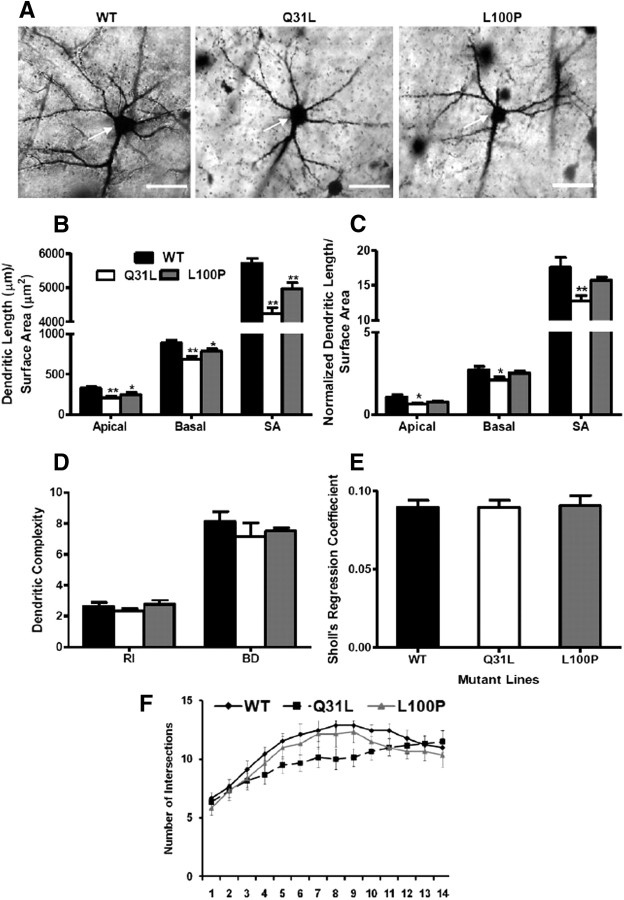
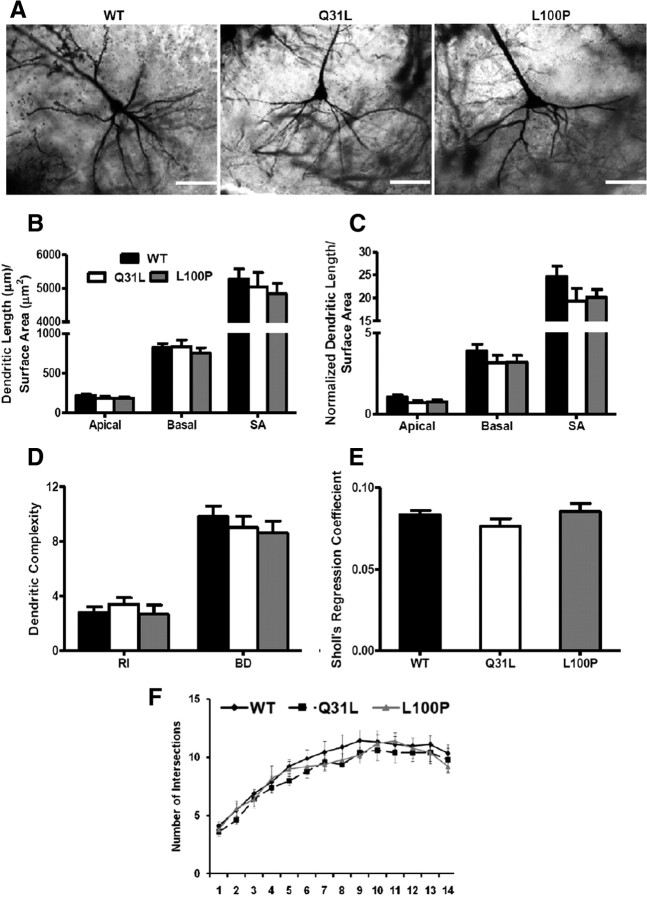
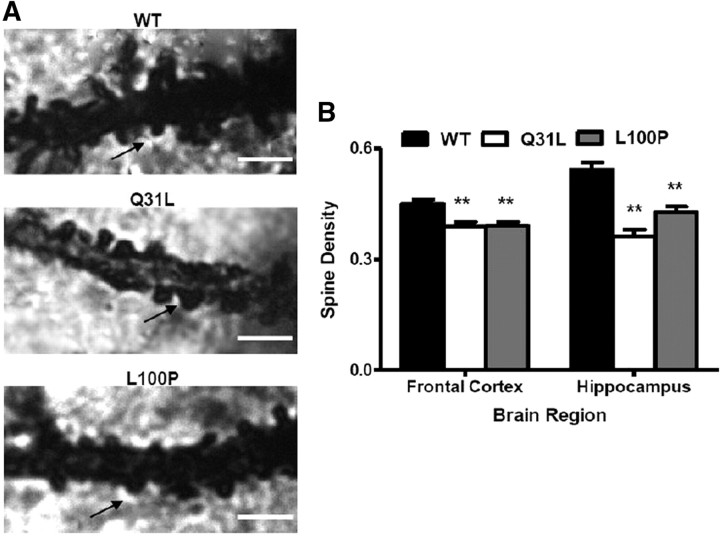
Disrupted-in-Schizophrenia 1 (DISC1) is a strong candidate gene for schizophrenia and other mental disorders. DISC1 regulates neurodevelopmental processes including neurogenesis, neuronal migration, neurite outgrowth, and neurotransmitter signaling. Abnormal neuronal morphology and cortical architecture are seen in human postmortem brain from patients with schizophrenia. However, the etiology and development of these histological abnormalities remain unclear. We analyzed the histology of two Disc1 mutant mice with point mutations (Q31L and L100P) and found a relative reduction in neuron number, decreased neurogenesis, and altered neuron distribution compared to wild-type littermates. Frontal cortical neurons have shorter dendrites and decreased surface area and spine density. Overall, the histology of Disc1 mutant mouse cortex is reminiscent of the findings in schizophrenia. These results provide further evidence that Disc1 participates in cortical development, including neurogenesis and neuron migration.


Figures

Figure 1.
Figure 1.
Relative reduction in cortical neuron density in Disc1 Q31L and L100P −/− mutant mice. A, NeuN-immunostained confocal images were converted to gray scale, and eight equal ROIs were delimited along the medial to lateral axis. Scale bar, 250 μm. B, C, Quantification of NeuN+ cells is shown in B for all eight ROIs, and in C each ROI showed significantly fewer neurons in both Q31L and L100P mutants (n = 14) when compared to WT littermates (n = 30; two-way ANOVA, p < 0.01). All data are presented as mean ± SEM; **p < 0.01 versus WT.
Figure 2.
Figure 2.
Decreased neuronal progenitor proliferation in Disc1 mutant mice. A, Coronal section of an E15 brain section with a higher magnification image of the different layers in the embryonic cortex (boxed area in the left image) shown in the right image. Scale bars, 250 μm (left) and 50 μm (right). BrdU was injected into pregnant dams at E14, and embryonic brains were collected at E15 for BrdU and Ki67 immunohistochemistry. CP, Cortical plate; IZ, intermediate zone. B, BrdU (red) and Ki67 (green) fluorescently labeled images of the SVZ/VZ region in WT, Q31L, and L100P mutants (left to right). White arrows indicate double-labeled (BrdU+ and Ki67+) cells. Scale bar, 30 μm. C, D, Quantification of BrdU+ (C) and Ki67+ (D) cells in a fixed ROI (100 μm × 120 μm) within the SVZ/VZ region revealed fewer BrdU- and Ki67-labeled cells in both Q31L and L100P mutants when compared to WT (n = 24; t test, p < 0.01). E, The cell cycle exit index is calculated as the fraction of cells labeled only with BrdU and no longer dividing (BrdU+ and Ki67) divided by the total number of BrdU+ cells. Only a small significant increase in the percentage of BrdU+/Ki67 cells was observed with the L100P mutants, but not the Q31L mutants, when compared to WT. All data are presented as mean ± SEM; *p < 0.05, **p < 0.01 vs WT.
Figure 3.
Figure 3.
Reduced BrdU incorporation and mispositioning of cortical neurons in Disc1 mutant mice. A, BrdU was injected into E12, E15, and E18 pregnant females of WT, Q31L, and L100P mutants. Mice were killed at P21 for BrdU and NeuN immunostaining. Scale bar, 250 μm. B, The total number of BrdU+ cells was significantly lower in both E12 and E15 BrdU-injected Q31L and L100P mutants, but only Q31L showed fewer labeled cells with BrdU injection at E18 when compared to WT (n = 7–20; t test, p < 0.01). C, The distribution of BrdU-labeled cells was analyzed across cortical layers in all BrdU-injected time points. A rectangular ROI of fixed width (500 μm), spanning the thickness of the frontal cortex, was defined in each slice. This rectangle was then divided into 10 equal deciles along the axis perpendicular to the pial surface. The number of BrdU-positive cells in each decile was counted, and is shown as a percentage of the number in entire ROI. There were more BrdU-positive cells in deeper layers for E12 and E15 time points in both mutants when compared to WT (n = 7–12; two-way ANOVA, p < 0.01). In contrast, the distribution of E18-injected BrdU-labeled cells was similar in all cortical layers between WT and mutants, with only a small number of BrdU-positive cells observed in both mutants in deep cortical layers but not in control mice. All data are presented as mean ± SEM; *p < 0.05, **p < 0.01 versus WT. I—VI, Cortical layers I-VI.
Figure 4.
Figure 4.
Altered cortical neuronal distribution in Disc1 mutant mice. A, Cux1-labeled (top) and Brn2-labeled (bottom row) fluorescent images of WT, Q31L, and L100P (left to right) brains showed a slight shift of distribution of neurons toward deeper cortical layers in the mutants. B, Two equal ROIs across the cortex of both the Cux1-labeled and Brn2-labeled neurons were outlined. Each ROI was subdivided into eight equal octants in which the number of Cux1+ and Brn2+ cells were counted and expressed as a percentage of total cells in each ROI. A significantly higher proportion of Cux1+ cells was observed in WT (n = 62) than in both Q31L (n = 36) and L100P mutants (n = 44) in the first and third octant. Conversely, the proportion of Cux1+ cells in the fourth octant was significantly lower in WT than the two mutants (two-way ANOVA, t test, p < 0.01). C, Similarly, more Brn2+ cells were present in superficial cortical layers (octants 1 and 2) in WT than in mutants, while fewer Brn2+ cells were seen in deeper cortical layers (octants 4, 5, and 6) in WT (n = 52; two-way ANOVA, t test, p < 0.01). Together, these results indicate that more Cux1-labeled and Brn2-labeled cells are positioned in deeper cortical layers in Disc1 mutants vs WT. D, The distance from the deep edge of the Cux1 fluorescent neurons to the pia versus total cortical thickness within each ROI was also significantly higher in both mutants (t test, p < 0.01). Scale bar, 250 μm. All data are presented as mean ± SEM; *p < 0.05, **p < 0.01 versus WT. I–VI, Cortical layers I-VI.
Figure 5.
Figure 5.
Morphology of neurons from the frontal cortex in Q31L and L100P −/− mutants. A, Golgi-stained images of an individual neuron at 40× magnification from WT, Q31L, and L100P mutant mice (left to right). Scale bar, 50 μm. The white arrows indicate pyramidal neurons with clear, distinct dendrites. B, Both Q31L and L100P mutants had shorter dendrites (apical and basal) and smaller surface area (SA) compared to WT neurons (n = 12; t test, p < 0.05). C, After normalizing to soma SA, only the Q31L mutants had significant differences in all three parameters, while no significant effects were observed with L100P mutants. However, a similar trend was still visible across all groups. D, No significant difference in dendritic branching complexity was observed when measured by Schoenen's ramification index (RI) and the number of bifurcations of dendrites (BD). E, Sholl analysis revealed no significant difference in Disc1 mutant mice versus WT on Sholl's regression coefficient (n = 12). F, Quantification of the number of dendritic intersections with increasing circular radius from the cell body was similar between WT and mutants. All data are presented as mean ± SEM; *p < 0.05, **p < 0.01 versus WT.
Figure 6.
Figure 6.
No alteration in morphology of hippocampal pyramidal neurons in Disc1 mutants. A, Golgi images of hippocampal neuron morphology in WT, Q31L, and L100P mutants. B, No significant difference was observed in dendritic length and surface area (SA) when compared to control mice (n = 12). C, Similarly, parameters after normalization were not significantly different among the measured groups. A slight decreasing trend was observed that parallels the frontal cortex results. DF, Hippocampal dendritic branching pattern was not significantly different as measured with Schoenen's ramification index (RI), the number of bifurcations of dendrites (BD), Sholl's regression coefficient analysis, and dendritic intersections with increasing radial segments. (n = 9–12). All data are presented as mean ± SEM. SA, Surface area.
Figure 7.
Figure 7.
Disc1 mutant mice had lower spine density in frontal cortical and hippocampal pyramidal neurons. A, High magnification (100×) of Golgi-stained images of spine protrusions on apical dendrites. Scale bar, 5 μm. Note the arrows indicating clear dendritic spines. B, Quantification of spine density (number of spines/μm) in all groups showed a significant lower density in mutant mice when compared to WT in frontal cortex and hippocampus (frontal cortex, n = 30; hippocampus, n = 26–33; t test, p < 0.01). All data are presented as mean ± SEM; **p < 0.01 versus WT.

References

    1. Akbarian S, Bunney WE, Jr, Potkin SG, Wigal SB, Hagman JO, Sandman CA, Jones EG. Altered distribution of nicotinamide-adenine dinucleotide phosphate-diaphorase cells in frontal lobe of schizophrenics implies disturbances of cortical development. Arch Gen Psychiatry. 1993;50:169–177. - PubMed
    1. Benes FM. Emerging principles of altered neural circuitry in schizophrenia. Brain Res Brain Res Rev. 2000;31:251–269. - PubMed
    1. Benes FM, Lange N. Two-dimensional versus three-dimensional cell counting: a practical perspective. Trends Neurosci. 2001;24:11–17. - PubMed
    1. Benes FM, Kwok EW, Vincent SL, Todtenkopf MS. A reduction of nonpyramidal cells in sector CA2 of schizophrenics and manic depressives. Biol Psychiatry. 1998;44:88–97. - PubMed
    1. Brandon NJ, Millar JK, Korth C, Sive H, Singh KK, Sawa A. Understanding the role of DISC1 in psychiatric disease and during normal development. J Neurosci. 2009;29:12768–12775. - PMC - PubMed

Publication types

MeSH terms

LinkOut - more resources