Comparative Study
. 2011 Mar 2;31(9):3217-24.
doi: 10.1523/JNEUROSCI.5626-10.2011.

Fractionating the default mode network: distinct contributions of the ventral and dorsal posterior cingulate cortex to cognitive control

Affiliations
Comparative Study

Fractionating the default mode network: distinct contributions of the ventral and dorsal posterior cingulate cortex to cognitive control

Robert Leech et al. J Neurosci. .

Abstract

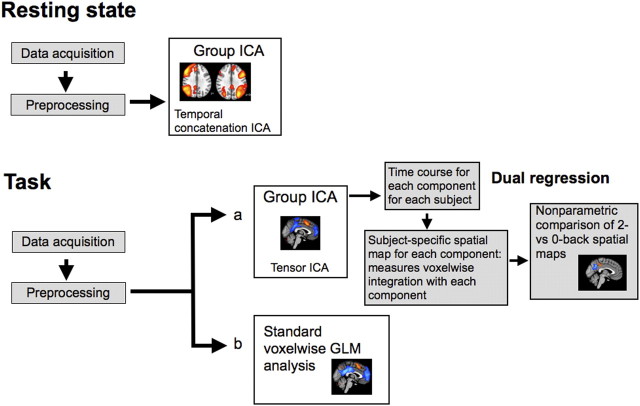
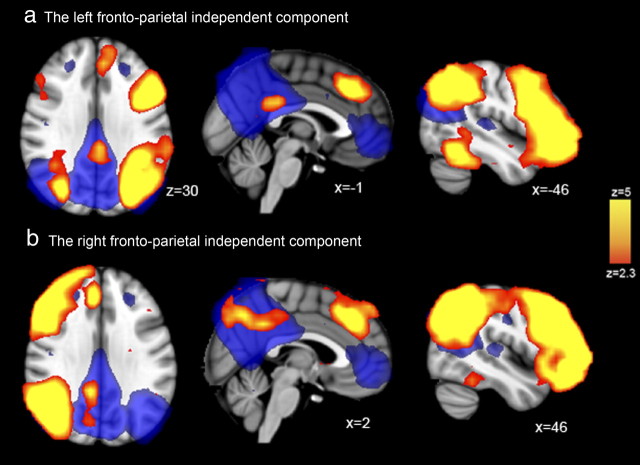
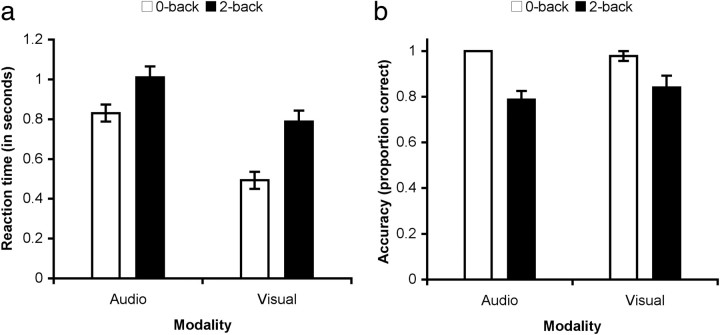
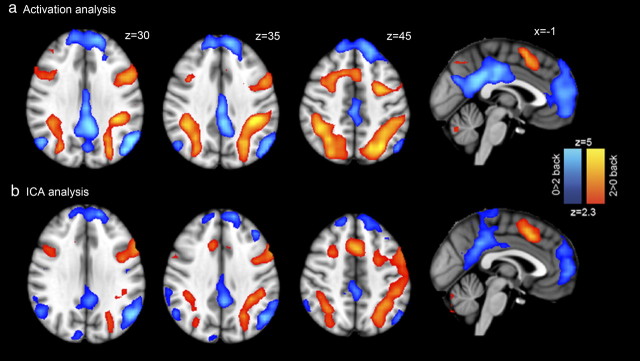
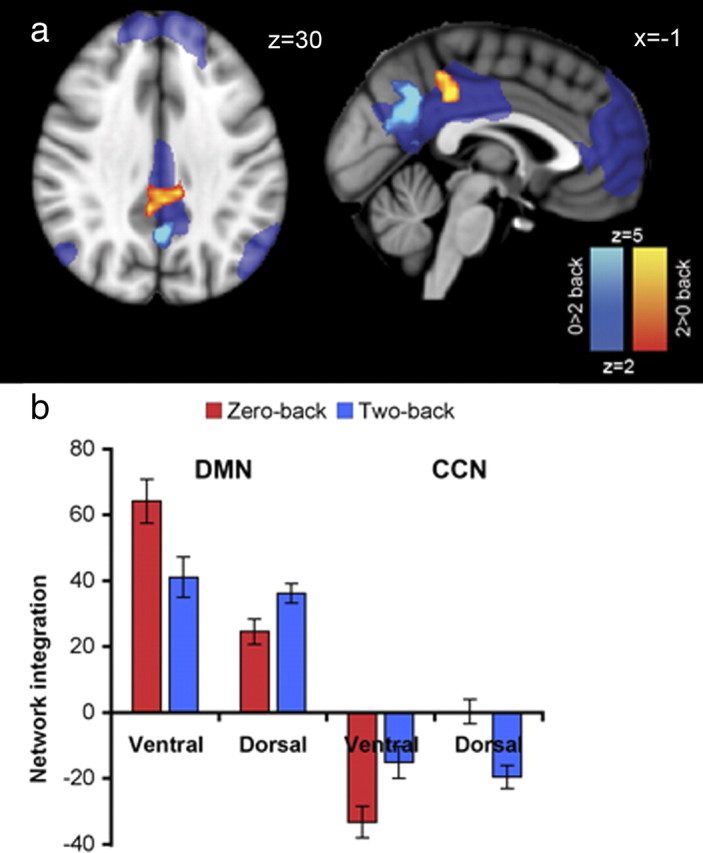
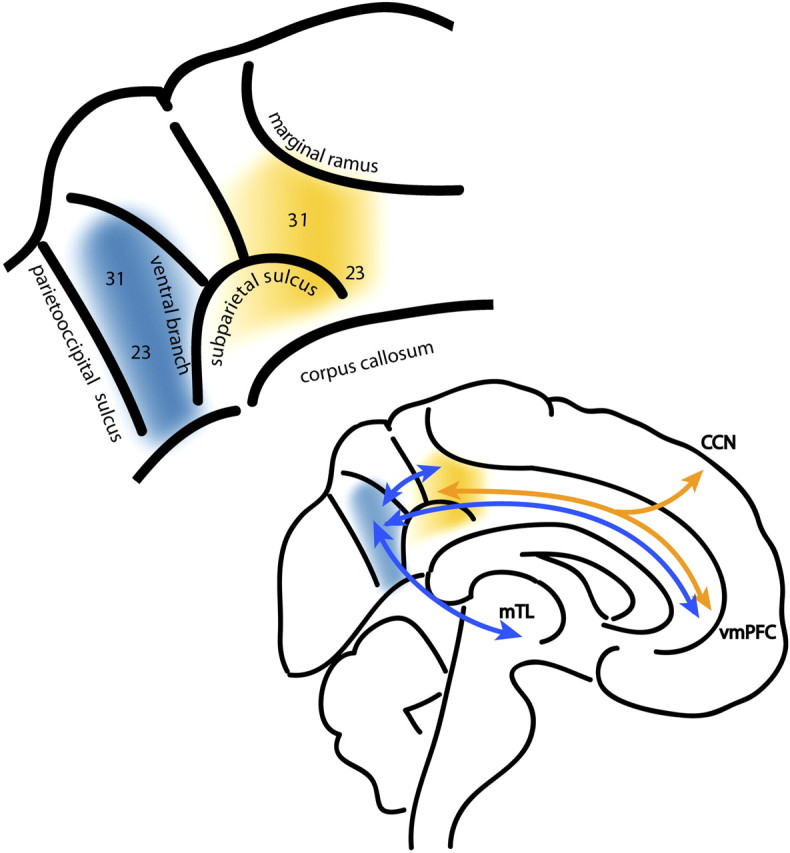
The posterior cingulate cortex (PCC) is a central part of the default mode network (DMN) and part of the structural core of the brain. Although the PCC often shows consistent deactivation when attention is focused on external events, anatomical studies show that the region is not homogeneous, and electrophysiological recordings in nonhuman primates suggest that it is directly involved in some forms of attention. We report a functional magnetic resonance imaging study of an attentionally demanding task (either a zero- or two-back working memory task). Standard subtraction analysis within the PCC shows a relative deactivation as task difficulty increases. In contrast, a dual-regression functional connectivity analysis reveals a clear dissociation between ventral and dorsal parts of the PCC. As task difficulty increases, the ventral PCC shows reduced integration within the DMN and less anticorrelation with the cognitive control network (CCN) activated by the task. The dorsal PCC shows an opposite pattern, with increased DMN integration and more anticorrelation. At rest, the dorsal PCC also shows functional connectivity with both the DMN and attentional networks. As expected, these results provide evidence that the PCC is involved in supporting internally directed thought, as the region is more highly integrated with the DMN at low task demands. In contrast, the task-dependent increases in connectivity between the dorsal PCC and the CCN are consistent with a role for this region in modulating the dynamic interaction between these two networks controlling the efficient allocation of attention.


Figures

Figure 1.
Figure 1.
A high-level description of the processing steps for rest and task fMRI data analysis, using activation and functional connectivity techniques.
Figure 2.
Figure 2.
Whole-brain results from a data-driven ICA analysis of resting-state fMRI data. The yellow regions in a and b are two distinct lateralized frontoparietal independent components derived from the whole population, typical of resting-state fMRI. Of note is that both of the frontoparietal components also contain dorsal PCC regions. To illustrate the relationship between these connected parts of the PCC and the DMN, the blue underlay shows the typical DMN, which is frequently observed with resting-state fMRI. MNI coordinates are shown for each slice.
Figure 3.
Figure 3.
Behavioral results for the N-back task. a, Group mean and SE of reaction time across participants for correct responses. b, Group mean and SE of the proportion of correct responses.
Figure 4.
Figure 4.
Cognitive control and default mode networks associated with N-back performance. a, Whole-brain results from general linear model analysis. Red–yellow regions show increase in activation with task difficulty (i.e., two-back > zero-back) within a frontoparietal executive network (cognitive control network). Blue–light blue regions show regions that deactivate with task difficulty (zero-back > two-back) within the DMN. Results are cluster corrected at p < 0.05. b, Whole-brain results from the data-driven ICA analysis. One component closely reflects the GLM analysis, showing activation of the frontoparietal executive network and deactivation within the DMN. Results are thresholded at a p > 0.5 level under an alternative hypothesis test based on a Gaussian/Gamma mixture model fitted to the intensity histogram of the component.
Figure 5.
Figure 5.
Activation differences between the auditory and visual versions of the N-back tasks. Increased auditory > visual activation is in red, and the reverse contrast is in blue (results are cluster corrected, p < 0.05).
Figure 6.
Figure 6.
Distinct connectivity within the dorsal and ventral PCC. a, Increasing integration with task difficulty in the dorsal PCC (i.e., two-back > zero-back) is shown in red–yellow. Decreases in integration with task difficulty in the ventral PCC (i.e., zero-back > two-back) are shown in dark–light blue. The areas showing relative deactivation for two-back > zero-back are shown as a transparent blue (i.e., the DMN revealed in Fig. 3a). Results are cluster corrected at p < 0.05. b, Integration values for the peak voxels (i.e., lowest p value) of the dorsal and the ventral PCC, shown combined for auditory and visual presentation. Integration values are the regression β coefficients resulting from the dual regression at each peak voxel. Integration is calculated separately for the DMN (on the left) and the CCN (on the right). The peak ventral PCC voxel was located at MNI 2, −58, 28. The peak dorsal PCC voxel was at MNI 2, −34, 40.
Figure 7.
Figure 7.
Top, The proposed functional subdivisions of PCC. The dorsal PCC is shown in warm colors and the ventral PCC in cold colors. The ventral branch of the subparietal sulcus anatomically separates the two functional regions (Vogt et al., 2006). Brodmann cytoarchitectonic regions 23 and 31 are labeled. Bottom, A schematic of the functional connectivity from the PCC subdivisions. The ventral and dorsal PCC are strongly interconnected and project to other regions of the DMN, including the ventromedial prefrontal cortex (vmPFC), and inferior parietal lobe (data not shown). The dorsal PCC shows stronger functional connectivity to “task-positive” regions within the cognitive control network, and we propose that the ventral PCC is more strongly functionally connected to medial temporal lobe (mTL) structures including the hippocampus.

References

    1. Beckmann CF, Smith SM. Probabilistic independent component analysis for functional magnetic resonance imaging. IEEE Trans Med Imaging. 2004;23:137–152. - PubMed
    1. Beckmann CF, Smith SM. Tensorial extensions of independent component analysis for group FMRI data analysis. Neuroimage. 2005;25:294–311. - PubMed
    1. Beckmann CF, Jenkinson M, Smith SM. General multilevel linear modeling for group analysis in FMRI. Neuroimage. 2003;20:1052–1063. - PubMed
    1. Beckmann CF, DeLuca M, Devlin JT, Smith SM. Investigations into resting-state connectivity using independent component analysis. Philos Trans R Soc Lond B Biol Sci. 2005;360:1001–1013. - PMC - PubMed
    1. Braver TS, Cohen JD, Nystrom LE, Jonides J, Smith EE, Noll DC. A parametric study of prefrontal cortex involvement in human working memory. Neuroimage. 1997;5:49–62. - PubMed

Publication types