Comparative Study
. 2011 Mar 2;31(9):3407-22.
doi: 10.1523/JNEUROSCI.5085-10.2011.

MicroRNA-9 regulates neurogenesis in mouse telencephalon by targeting multiple transcription factors

Affiliations
Comparative Study

MicroRNA-9 regulates neurogenesis in mouse telencephalon by targeting multiple transcription factors

Mikihito Shibata et al. J Neurosci. .

Abstract

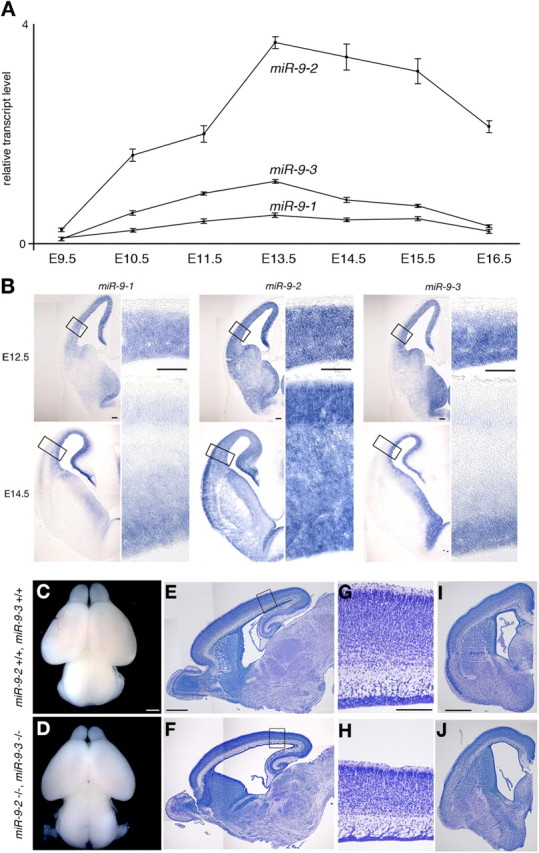
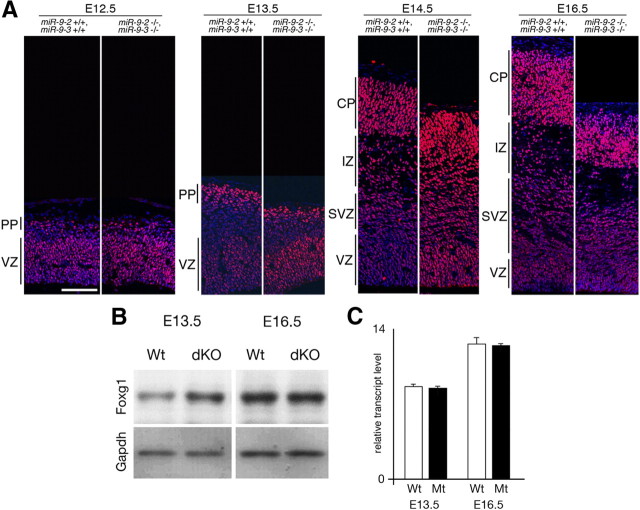
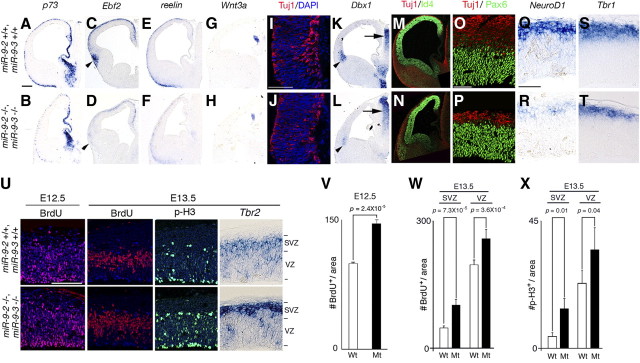
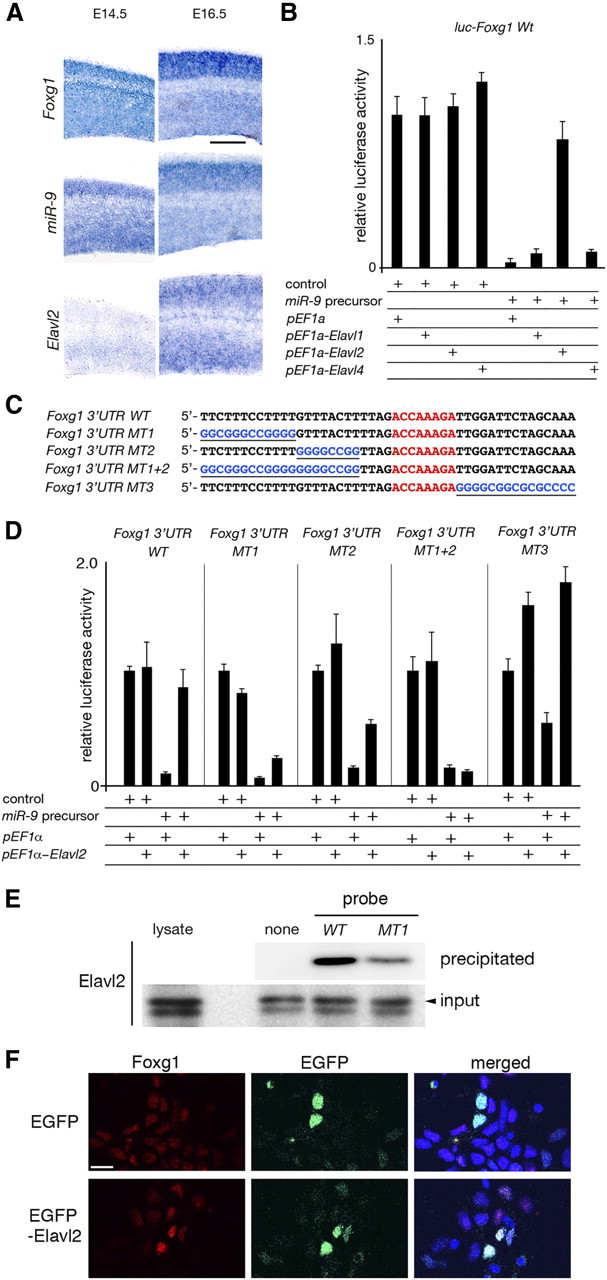
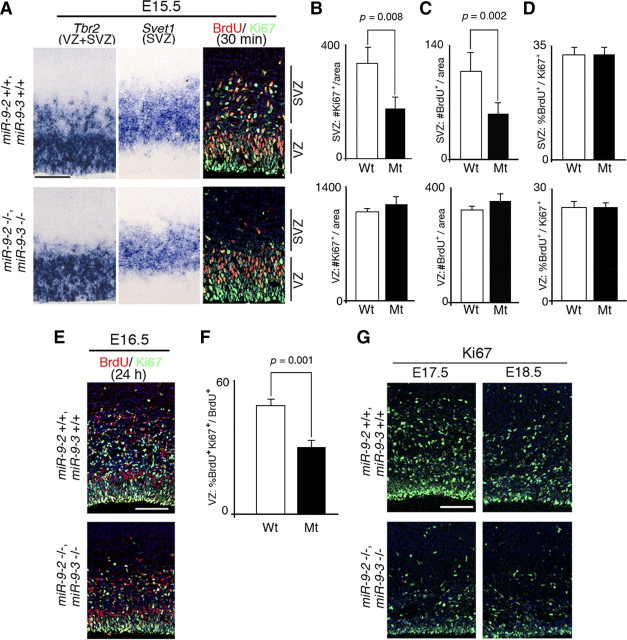
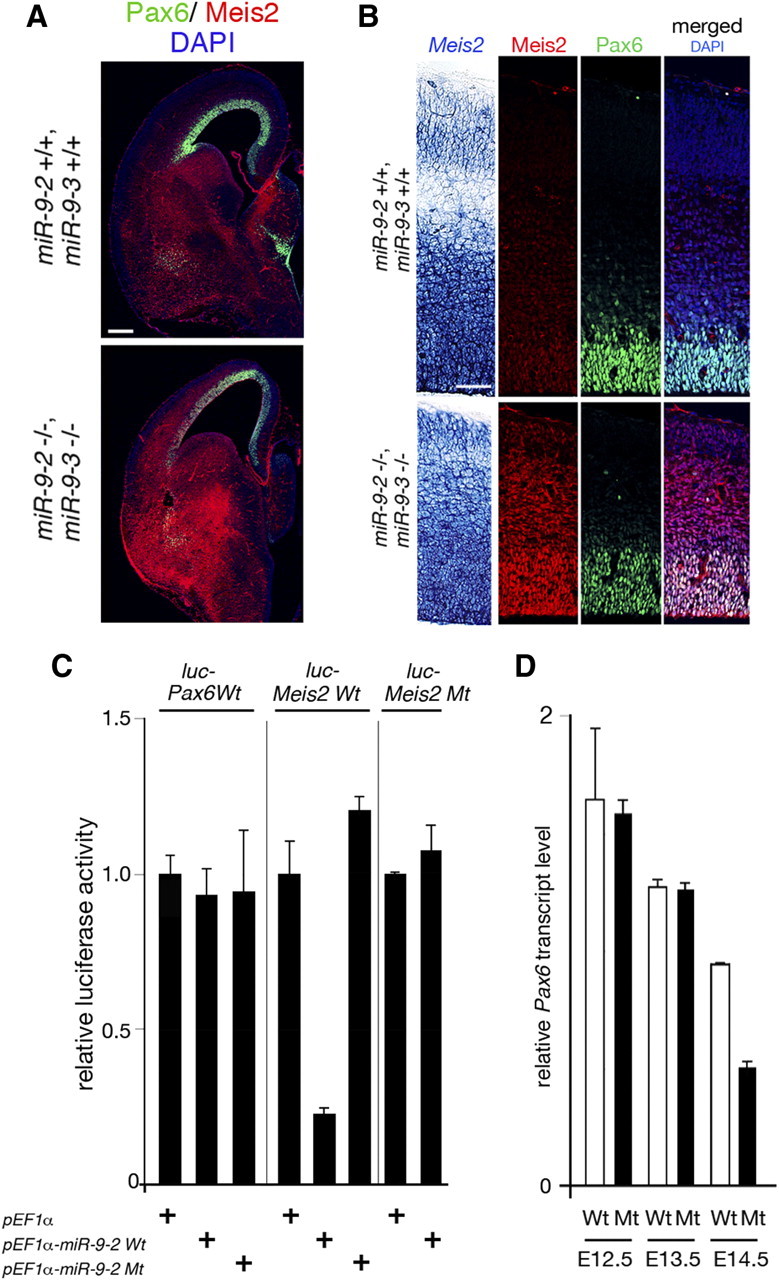
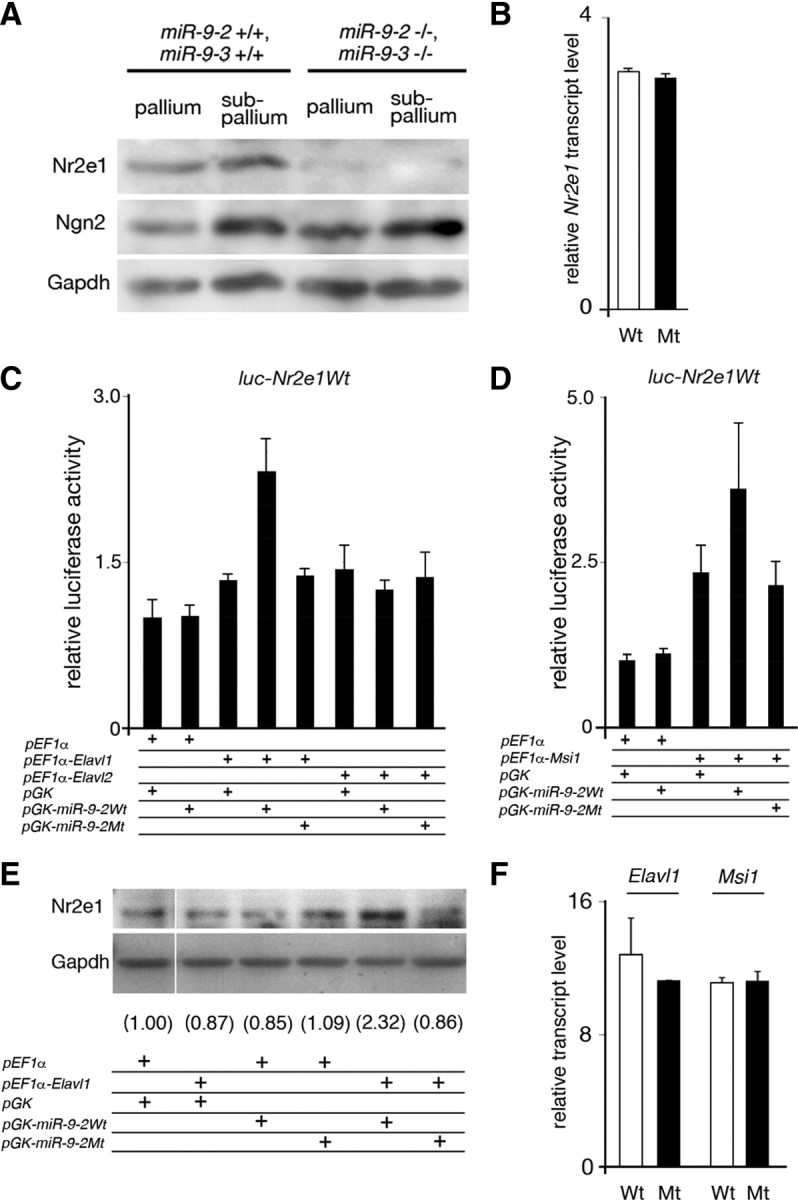
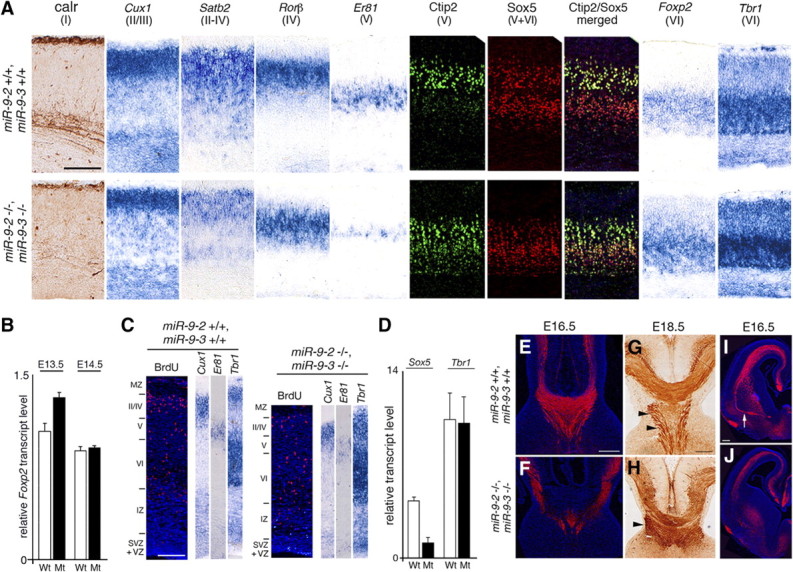
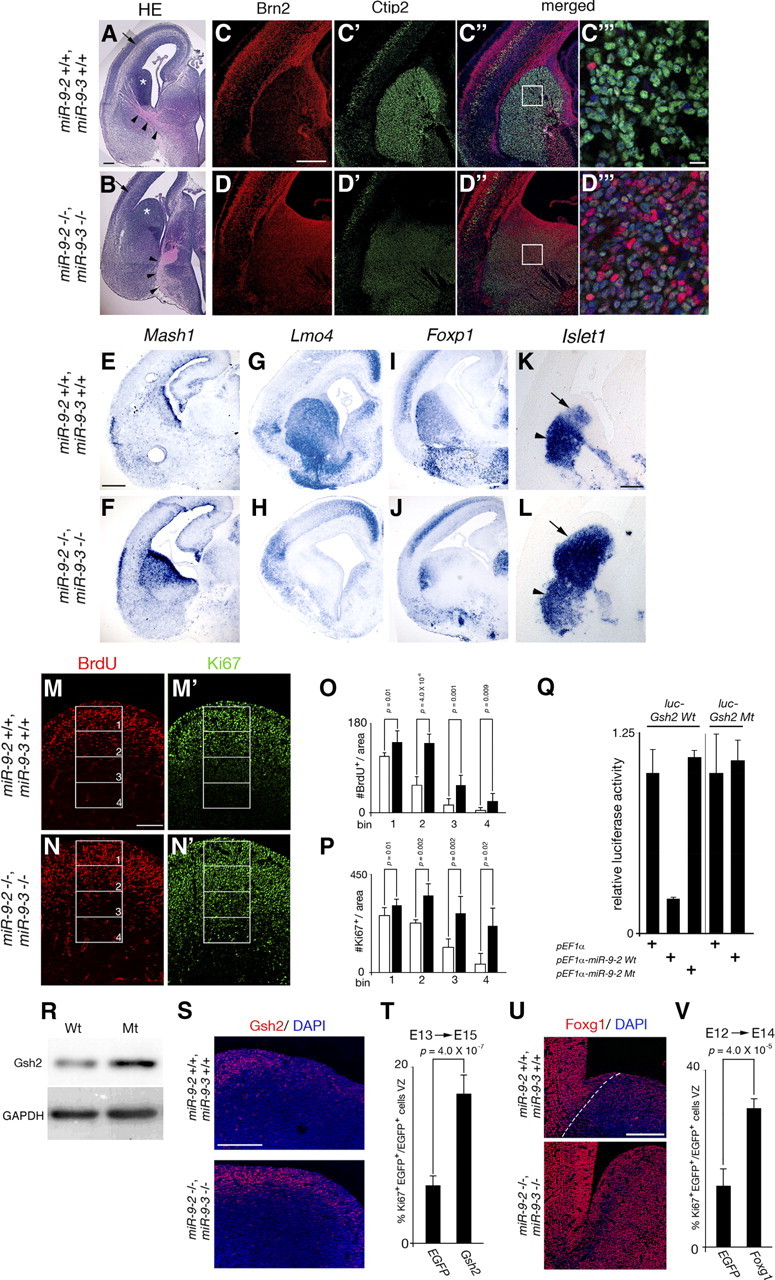
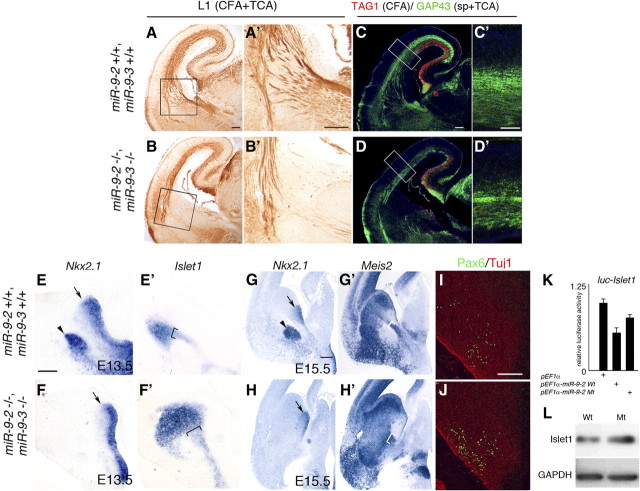
microRNA-9-2 and microRNA-9-3 double-mutant mice demonstrate that microRNA-9 (miR-9) controls neural progenitor proliferation and differentiation in the developing telencephalon by regulating the expression of multiple transcription factors. As suggested by our previous study, the Foxg1 expression was elevated, and the production of Cajal-Retzius cells and early-born neurons was suppressed in the miR-9-2/3 double-mutant pallium. At embryonic day 16.5 (E16.5), however, the Foxg1 expression was no longer elevated. The expression of an AU-rich RNA-binding protein Elavl2 increased at E16.5, Elav2 associated with Foxg1 3' untranslated region (UTR), and it countered the Foxg1 suppression by miR-9. Later, progenitor proliferation was reduced in the miR-9-2/3 double-mutant pallium with the decrease in Nr2e1 and Pax6 expression and the increase in Meis2 expression. The analyses suggest that microRNA-9 indirectly inhibits Pax6 expression by suppressing Meis2 expression. In contrast, together with Elavl1 and Msi1, microRNA-9 targets Nr2e1 mRNA 3' UTR to enhance the expression. Concomitantly, cortical layers were reduced, each cortical projection was malformed, and the tangential migration of interneurons into the pallium was impaired in the miR-9-2/3 double mutants. miR-9 also targets Gsh2 3' UTR, and Gsh2, as well as Foxg1, expression was elevated in the miR-9-2/3 double-mutant subpallium. The subpallium progenitor proliferation was enhanced, and the development of basal ganglia including striatum and globus pallidus was suppressed. Pallial/subpallial boundary shifted dorsally, and the ventral pallium was lost. Corridor was malformed, and thalamocortical and corticofugal axons were misrouted in the miR-9-2/3 double mutants.


Figures

Figure 1.
Figure 1.
miR-9-2/3 double mutation. A, Quantitative RT-PCR analyses of expression levels of miR-9 precursors in developing cerebral hemispheres at the indicated stages. See Materials and Methods for relative transcript level. B, Expression pattern of each miR-9 precursor in E12.5 and E14.5 telencephalon by RNA in situ hybridization. In each miR-9 precursor expression, the right panels give enlarged views of the areas boxed in the left panels. C–J, Gross phenotypes of miR-9-2/3 double mutants at P1. Dorsal views (C, D), parasagittal sections (E, F), and frontal sections at the telencephalic level (I, J) of F2 wild-type and miR-9-2/3 double-mutant brains, respectively. G and H gives enlarged views of the cortices boxed in E and F. E–J, Nissl staining. Scale bars: B, 100 μm; C–F, I, J, 500 μm; G, H, 200 μm.
Figure 2.
Figure 2.
Foxg1 expression in miR-9-2/3 double-mutant pallium. A, Immunostaining with an anti-Foxg1 antibody of cortices at indicated stages. Layers are indicated as VZ, preplate (PP), SVZ, intermediate zone (IZ), and cortical plate (CP). B, Western blotting for Foxg1 expression in cerebral hemispheres dissected at E13.5 and E16.5. Relative intensities of Foxg1 bands in the double mutant are 2.0-fold and 1.0-fold of the wild type at E13.5 and E16.5, respectively, as estimated by normalizing the intensities against those of Gapdh bands. C, Quantitative RT-PCR for Foxg1 transcripts. Wt, Wild type; Mt, miR-9-2/-3 double mutant; dKO, double knock-out. Scale bar, 100 μm.
Figure 3.
Figure 3.
Early neurogenesis in miR-9-2/3 double-mutant pallium. A–R, Marker analyses of early-born neurons at E12.5. A–H, K, L, and Q–T give RNA in situ hybridization for genes indicated; I, J, M–P, immunostaining with an anti-Tuj1 antibody (red) and 4′,6′-diamidino-2-phenylindole (DAPI) (blue) at the cortical hem region (I, J), with anti-Tuj1 antibody and an anti-Id4 antibody (green) in telencephalon (M, N) or with anti-Tuj1 antibody and anti-Pax6 antibody (green) in the pallium (O, P). Arrowheads in C, D, K, and L indicate the ventral pallium, and arrows in K and L indicate the normal Dbx1 expression in the thalamus. Scale bars: A–H, K–N, 200 μm; I, J, 100 μm; O–T, 50 μm. U, Typical examples of distribution of BrdU-incorporated cells after 30 min labeling, of distribution of phospho-histone H3-positive cells, and of RNA in situ hybridization for SVZ marker, Tbr2 in the neopallium at either E12.5 or E13.5. V, Quantification of BrdU-positive cells in the entire E12.5 pallium. W, X, Quantification of BrdU-positive cells (W) and phospho-histone H3-positive cells (X) in the VZ and SVZ at E13.5. Quantification in V–X was performed as described in Materials and Methods. Scale bar (in U), 100 μm.
Figure 4.
Figure 4.
Elavl2 counteraction of the miR-9-2 suppression of Foxg1 expression. A, RNA in situ hybridization of Foxg1, miR-9, and Elavl2 expression in the wild-type neopallium at E14.5 and E16.5. B, Effects of Elavl paralogs on the miR-9-2 suppression of luciferase expression from a luciferase reporter conjugated to the Foxg1 3′ UTR in P19 cells. See Materials and Methods for relative luciferase activity. C, Sequences of the wild-type Foxg1 U-rich 3′ UTR and its mutant forms; miR-9 responsive elements are indicated by red letters, and substituted sequences are underlined and in blue letters. D, Luciferase expression from luciferase reporters conjugated to the wild-type and mutant Foxg1 3′ UTRs described in C. E, Elavl2 protein interaction with Foxg1 3′ UTR. Protein lysates from E17.5 cortices were incubated with biotinylated Foxg1 3′ UTR WT or Foxg1 3′ UTR MT1 RNA probe. Probes were precipitated with streptavidin-coated beads, and bound Elavl2 protein was detected by Western blotting using anti-Elavl2 antibody. F, Increase in Foxg1 expression by Elavl2 overexpression in E12.5 cortical cells. E12.5 cortical cells were dissociated, electroporated with control EGFP or EGFP--Elavl2 expression vector, and cultured for 48 h. Foxg1 expression was examined by immunostaining. Scale bars: A, 200 μm; F, 10 μm.
Figure 5.
Figure 5.
Progenitor proliferation in later miR-9-2/3 double-mutant pallium. A, Typical examples of RNA in situ hybridization of Tbr2 and Svet1 expression for the VZ and SVZ, and 30 min BrdU labeling and Ki67 staining for S phase and cycling cells in the pallium at E15.5, respectively. B, C, Quantification of Ki67-positive (B) and BrdU-positive (C) cells in the SVZ and VZ. D, Cell cycle length as indicated by the number of BrdU and Ki67 double-positive cells among Ki67-positive cycling cells in the SVZ and VZ. E, Typical examples of 24 h BrdU labeling and Ki67 staining for cells reentering the cell cycle in the VZ at E16.5. F, Quantification of the cells reentering the cell cycle as the ratio of Ki67 and BrdU double-positive cells among BrdU-positive cells. G, Typical examples of Ki-67 staining of E17.5 and E18.5 cortices. Quantification was performed as described in Materials and Methods. Scale bars: A, E, G, 100 μm.
Figure 6.
Figure 6.
miR-9 regulation of Pax6 expression. A, Immunohistology of Pax6 (green) and Meis2 (red) protein expression in the E15.5 telencephalon. B, RNA in situ hybridization of Meis2 expression, anti-Meis2 or anti-Pax6 staining, and merged views of Meis2 and Pax6 protein expression with DAPI staining in the E15.5 pallium. C, miR-9-2 suppression of luciferase expression from a reporter conjugated to the wild-type and mutant Pax6 and Meis2 3′ UTRs; in mutant miR-9-2 (miR-9-2Mt), the mutation was introduced in the miR-9 seed sequences. D, Quantitative RT-PCR analyses of Pax6 mRNA expression at indicated stages. Scale bars: A, 200 μm; B, 50 μm.
Figure 7.
Figure 7.
miR-9 regulation of Nr2e1 expression. A, Western blotting for Nr2e1 expression in E13.5 pallium and subpallium, with Ngn2 as a negative control and Gapdh as a loading control. B, Quantitative RT-PCR for Nr2e1 mRNA expression in cerebral hemispheres dissected at E16.5. C, D, Effects of Elavl1 and Elavl2 (C) and Msi1 (D) on luciferase expression from a luciferase reporter conjugated to the Nr2e1 3′ UTR in P19 cells. No miR-9 suppression of luciferase expression was observed from luciferase reporters conjugated to the 1.4 kb full-length Nr2e1 3′ UTR (C, D) as used by Zhao et al. (2009) or with four tandem repeats of its 50 nt fragment containing miR-9 responsive element (data not shown). E, Increase in the endogenous Nr2e1 expression in P19 cells by Elavl1 and miR-9. P19 cells were transfected with Elavl1 and/or miR-9 expression vectors as indicated, and Nr2e1 expression was detected by Western blotting. Numerals give the relative intensity of each Nr2e1 band to that in control in which pEF1α and pGK vectors were transfected; each band intensity was normalized by the intensity of Gapdh band. F, Quantitative RT-PCR analysis of Elavl1 and Msi1 mRNA expression in wild and miR-9-2/3 double-mutant cortices at E16.5.
Figure 8.
Figure 8.
Layer formation in miR-9-2/3 double-mutant neopallium. A, Marker analysis for layer formation at E18.5. B, Quantification of Foxp2 mRNA expression at indicated stages. C, Birthdating analysis of the E18.5 cortex by BrdU labeling at E14.5. D, Quantitative RT-PCR analysis of Sox5 and Tbr1 mRNA expression in the pallium at E14.5. E–J, Anti-L1 staining for corpus callosum, fornix/hippocampal commissure (arrowheads), and anterior commissure (arrow). Sections in E, F, I, and J were immunostained as described in Materials and Methods, whereas the section in G and H was stained with 3,3′-diaminobenzidine tetrahydrochloride after immunoreaction with the secondary antibody conjugated to horseradish peroxidase. Scale bars: A, E–J, 200 μm; C, 100 μm.
Figure 9.
Figure 9.
miR-9 regulation of cell proliferation and neural differentiation in the subpallium. A, B, Coronal sections of the E15.5 telencephalon stained with hematoxylin/eosin. Arrowheads indicate TCA trajectories, and arrows the intermediate zones. C, D, Anti-Brn2 staining of the E18.5 subpallium for the proliferative zone. C′, D′, Anti-Ctip2 staining for the striatal neurons in the adjacent sections. C″, D″, Their merged views. C‴, D‴, The enlarged views of the regions boxed in C″, D″. E–L, RNA in situ hybridization of Mash1 (E, F) expression for the proliferative zone at E17.5, of Lmo4 (G, H) and Foxp1 (I, J) expression for the striatal neurons at E17.5, and of Islet1 (K, L) expression for striatal neurons (arrowheads) and SVZ (arrows) at E15.5. M–N′, Typical examples of 30 min BrdU labeling for S-phase cells (M, N) and Ki67 staining for cycling cells (M′, N′) in the E15.5 LGE. O, P, The number of BrdU-positive (O) and Ki67-positive (P) cells in the four bins along the ventricular–pial axis of the LGE shown in M–N′. Quantification was performed as described in Materials and Methods. Q, Luciferase expression from a luciferase reporter conjugated to the wild-type and mutant Gsh2 3′ UTR: the mutation was introduced in the miR-9 responsive element. R, Western blotting for Gsh2 expression in cerebral hemispheres at E15.5. Quantification of the Gsh2 protein level by normalizing with Gapdh levels (loading control) indicated 1.7-fold increase in miR-9-2/3 double-mutant telencephalon. S, Anti-Gsh2 staining in the wild-type and double-mutant E15.5 LGE region. T, V, The effects of Gsh2 (T) and Foxg1 (V) overexpression by exo utero electroporation at E13 or E12 on cell proliferation in the subpallium at E15 or E14, respectively. The percentage of Ki67 and EGFP double-positive cells among total EGFP-positive cells is indicated. Quantification was performed as described in Materials and Methods. U, Anti-Foxg1 staining in the wild-type and miR-9-2/3 double-mutant E15.5 LGE region. A–L, M–N′, S, and U are all coronal views. Nr2e1 is known to promote cell proliferation in subpallium (Stenman et al., 2003c), and thus the reduction in Nr2e1 expression in E15.5 miR-9-2/3 double-mutant subpallium (Fig. 7A) cannot account for the hyperproliferation of progenitors in the miR-9-2/3 double-mutant subpallium. The areas of each bin in (M–N′) are 180 × 100 μm. Scale bars: A, B, M–N′, 100 μm; C–D″, E–L, 300 μm; C‴, D‴, 10 μm; S, U, 200 μm.
Figure 10.
Figure 10.
Corticofugal and thalamocortical projections with corridor malformation in miR-9-2/3 double-mutant subpallium. A, B, Anti-L1 staining for CFAs and TCAs at E18.5. A′, B′, Enlarged views of the internal capsule areas boxed in A and B. C, D, Anti-TAG1 (red) and anti-GAP43 (green) staining for CFAs and TCAs/subplate at E18.5. C′, D′, Enlarged views of the areas boxed in C and D. Scale bars: A–D, 100 μm; C′, D′, 50 μm. RNA in situ hybridization of Nkx2.1 for the proliferating field of the MGE and globus pallidus at E13.5 (E, F), of Islet1 for corridor in sections adjacent to E and F (E′,F′), and of Nkx2.1 (G, H) and Meis2 (G′, H′) for the ventral telencephalon in adjacent sections at E15.5. I, J, Anti-Pax6 (green) and Tuj1 (red) staining in the E15.5 subpallium. Arrowheads indicate the globus pallidus in E and G; arrows indicate the MGE VZ in E–H, and brackets indicate the corridor in E′–H′. Scale bars: E–F′, 50 μm; G–H′, 200 μm; I, J, 100 μm. K, miR-9-2 suppression of luciferase expression from a reporter conjugated to the Islet1 3′ UTR. L, Moderate increase of Islet1 expression in E13.5 miR-9-2/3 double-mutant cerebral hemispheres.

Similar articles

Cited by

References

    1. Abramoff MD, Magelhaes PJ, Ram SJ. Image processing with ImageJ. Biophotonics Int. 2004;11:36–42.
    1. Agoston Z, Schulte D. Meis2 competes with the Groucho co-repressor Tle4 for binding to Otx2 and specifies tectal fate without induction of a secondary midbrain-hindbrain boundary organizer. Development. 2009;136:3311–3322. - PubMed
    1. Anderson SA, Qiu M, Bulfone A, Eisenstat DD, Meneses J, Pedersen R, Rubenstein JL. Mutations of the homeobox genes Dlx-1 and Dlx-2 disrupt the striatal subventricular zone and differentiation of late born striatal neurons. Neuron. 1997;19:27–37. - PubMed
    1. Arlotta P, Molyneaux BJ, Jabaudon D, Yoshida Y, Macklis JD. Ctip2 controls the differentiation of medium spiny neurons and the establishment of the cellular architecture of the striatum. J Neurosci. 2008;28:622–632. - PMC - PubMed
    1. Bartel DP. MicroRNAs: target recognition and regulatory functions. Cell. 2009;136:215–233. - PMC - PubMed

Publication types

MeSH terms