Comparative Study
. 2011 Mar 2;31(9):3423-8.
doi: 10.1523/JNEUROSCI.4893-10.2011.

Use-dependent hemispheric balance

Affiliations
Comparative Study

Use-dependent hemispheric balance

Laura Avanzino et al. J Neurosci. .

Abstract

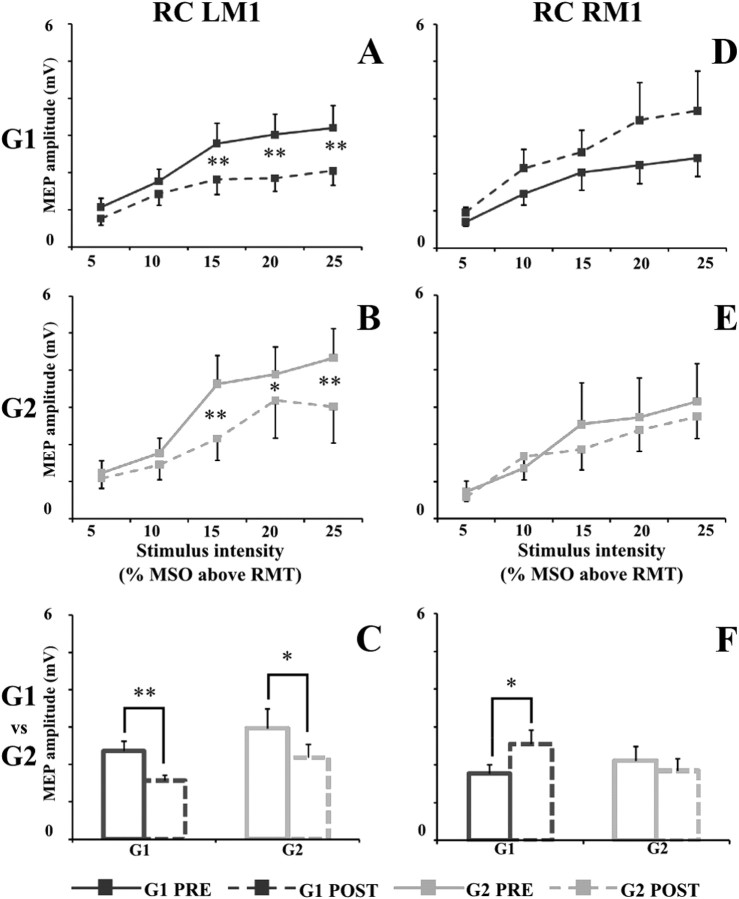
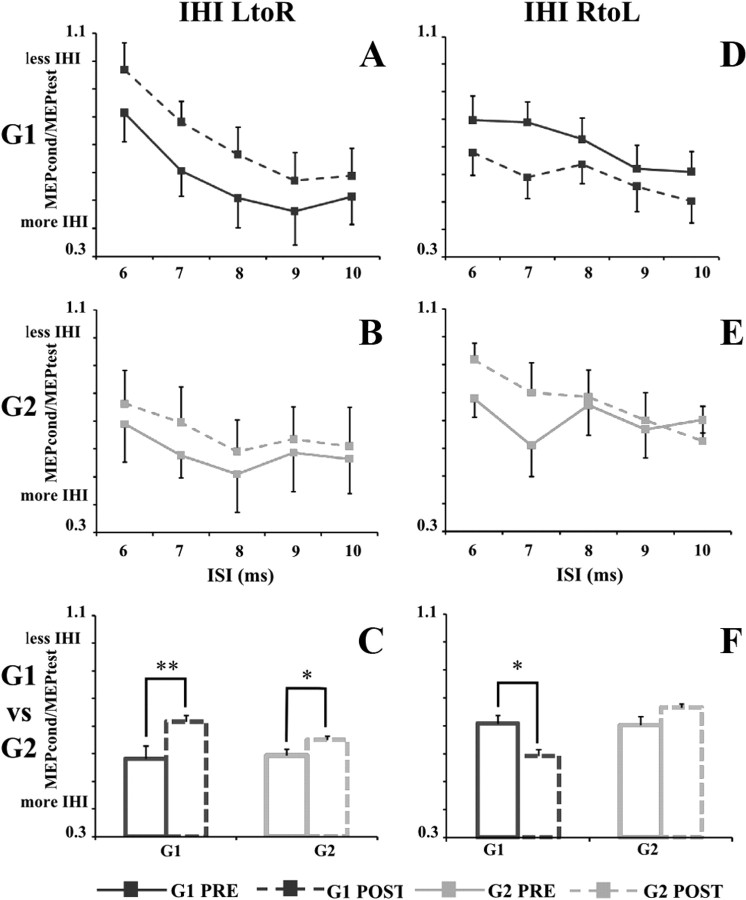
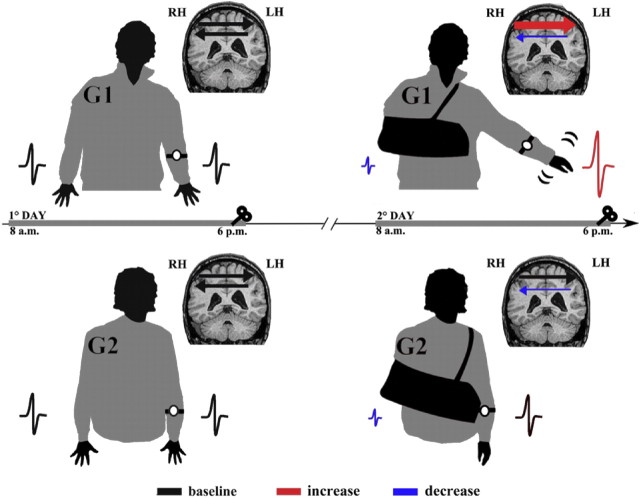
In the human brain, homologous regions of the primary motor cortices (M1s) are connected through transcallosal fibers. Interhemispheric communication between the two M1s plays a major role in the control of unimanual hand movements, and the strength of this connection seems to be dependent on arm activity. For instance, a lesion in the M1 can induce an increase in the excitability of the intact M1 and an abnormal high inhibitory influence onto the damaged M1. This can be attributable to either the disuse of the affected limb or the overuse of the unaffected one. Here, to directly investigate cortical modifications induced by an abnormal asymmetric use of the two limbs, we studied both the excitability of the two M1s and transcallosal interaction between them in healthy subjects whose right hand was immobilized for 10 h. The left "not-immobilized" arm was completely free to move in one group of participants (G1) and limited in the other one (G2). We found that the non-use reduced the excitability of the left M1 and decreased the inhibitory influence onto the right hemisphere in the two groups. However, an increase in the excitability of right M1 and a deeper inhibitory interaction onto the left hemisphere were evident only in G1. Thus, modifications in the right M1 were not directly produced by the non-use but would depend on the overuse of the "not-immobilized" arm. Our findings suggest that the balance between the two M1s is strongly use dependent.


Figures

Figure 1.
Figure 1.
Left and right motor cortex RC in G1 (dark gray square) and G2 (light gray square) before (PRE; solid line) and after (POST; dashed line) immobilization. A (G1) and B (G2) illustrate the MEP recruitment curve (peak-to-peak amplitude, in millivolts, on the ordinate) of left motor cortex (LM1), whereas D (G1) and E (G2) illustrate the MEP recruitment curve of right motor cortex (RM1). On the abscissa, the stimulus intensities are shown (5, 10, 15, 20, and 25% of MSO above RMT). On C and F, the mean values of MEP sizes in G1 (dark gray) and G2 (light gray) before (solid line) and after (dashed line) immobilization are shown. Data are represented as mean values ± SE. In A, B, D, and E, asterisks indicate significant difference between pre and post values when interaction of time × intensity was statistically significant. In C and F, asterisks indicate the main effect of time. *p < 0.05, **p < 0.01.
Figure 2.
Figure 2.
IHI from LtoR and RtoL hemispheres in G1 (dark gray square) and G2 (light gray square) before (PRE, solid line) and after (POST, dashed line) immobilization. A (G1) and B (G2) illustrate LtoR IHI expressed as the ratio between the mean peak-to-peak MEP amplitude in conditioned versus unconditioned trials (MEPcond/MEPtest on the ordinate), whereas D (G1) and E (G2) illustrate the RtoL IHI. On the abscissa, the ISIs (6, 7, 8, 9, and 10 ms) are shown. On C and F, the mean values of IHI in G1 (dark gray) and G2 (light gray) before (solid line) and after (dashed line) immobilization are shown. Data are represented as mean values ± SE. In A, B, D, and E, asterisks indicate significant difference between pre and post values when interaction of time × ISI was statistically significant. In C and F, asterisks indicate the main effect of time. *p < 0.05, **p < 0.01.
Figure 3.
Figure 3.
A schematic view of the experimental design and main results. All participants in G1 and G2 were instructed not to use the dominant (right) hand for 10 h, wearing a soft bandage. The use of the left, not-immobilized arm was monitored by means of an actigraph for 10 h during the period of immobilization (2° day) and 1 d before (1° day). MEP size decreased in the left hemisphere (reduced MEP in blue, compare with black one) in both G1 and G2, whereas it increased in the right hemisphere only in G1 (increased MEP in red, compare with black one). LtoR IHI was reduced in both G1 and G2 (thin arrow in blue, compare with black one), whereas RtoL IHI was deeper only in G1(thick arrow in red, compare with black one).

References

    1. Ainsworth BE, Haskell WL, Whitt MC, Irwin ML, Swartz AM, Strath SJ, O'Brien WL, Bassett DR, Jr, Schmitz KH, Emplaincourt PO, Jacobs DR, Jr, Leon AS. Compendium of physical activities: an update of activity codes and MET intensities. Med Sci Sports Exerc. 2000;32:S498–S504. - PubMed
    1. Allison T, McCarthy G, Wood CC. The relationship between human long-latency somatosensory evoked potentials recorded from the cortical surface and from the scalp. Electroencephalogr Clin Neurophysiol. 1992;84:301–314. - PubMed
    1. Asanuma H, Okuda O. Effects of transcallosal volleys on pyramidal tract cell activity of cat. J Neurophysiol. 1962;25:198–208. - PubMed
    1. Avanzino L, Teo JT, Rothwell JC. Intracortical circuits modulate transcallosal inhibition in humans. J Physiol. 2007;583:99–114. - PMC - PubMed
    1. Avanzino L, Bove M, Trompetto C, Tacchino A, Ogliastro C, Abbruzzese G. 1-Hz repetitive TMS over ipsilateral motor cortex influences the performance of sequential finger movements of different complexity. Eur J Neurosci. 2008;27:1285–1291. - PubMed

Publication types

LinkOut - more resources