. 2011 Jun;25(6):1943-59.
doi: 10.1096/fj.10-176487. Epub 2011 Mar 2.

Sequenced response of extracellular matrix deadhesion and fibrotic regulators after muscle damage is involved in protection against future injury in human skeletal muscle

Affiliations

Sequenced response of extracellular matrix deadhesion and fibrotic regulators after muscle damage is involved in protection against future injury in human skeletal muscle

Abigail L Mackey et al. FASEB J. 2011 Jun.

Abstract

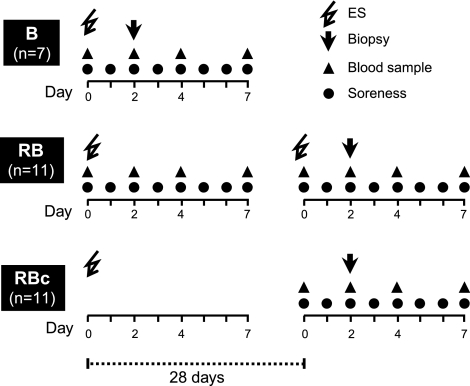
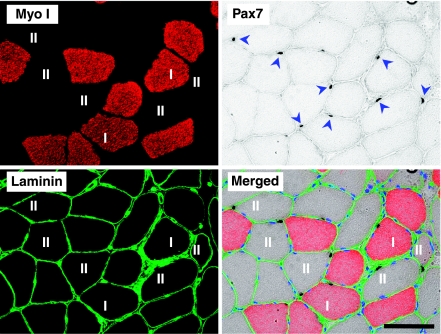
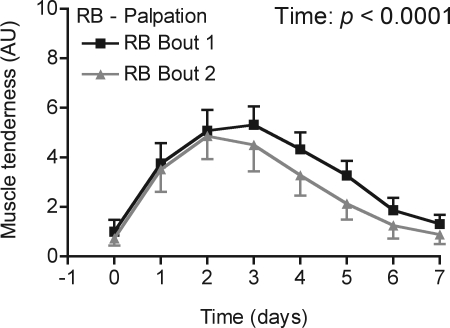
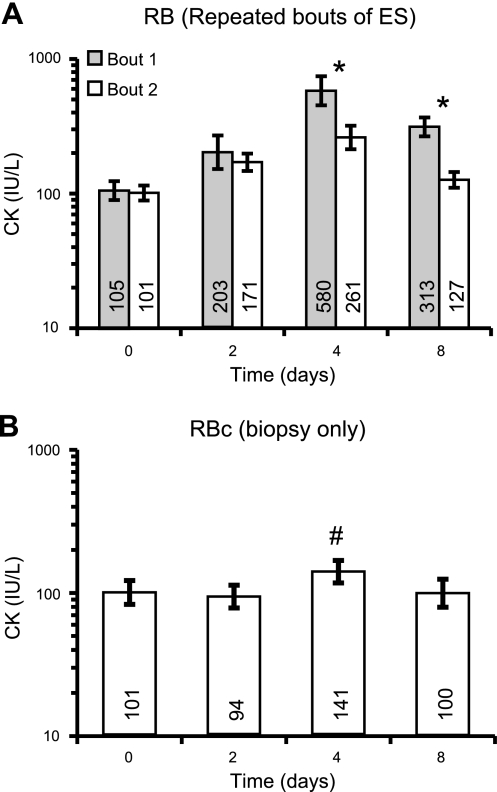
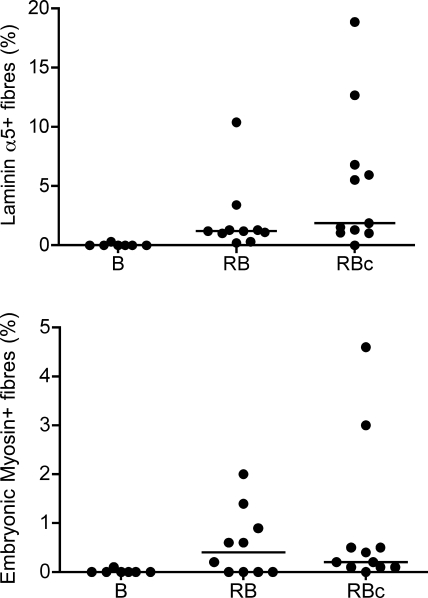
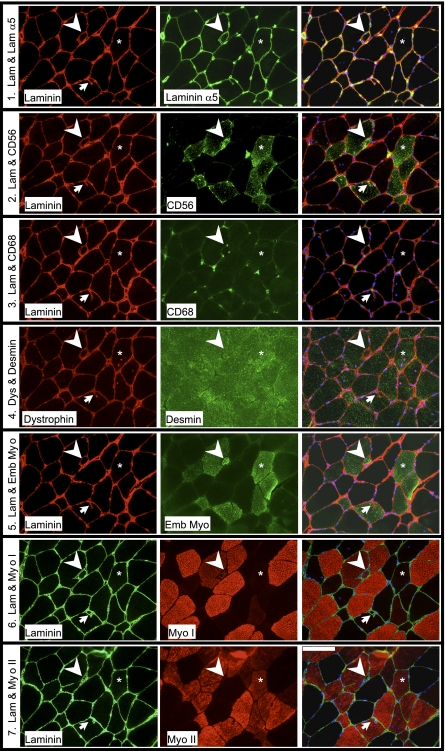
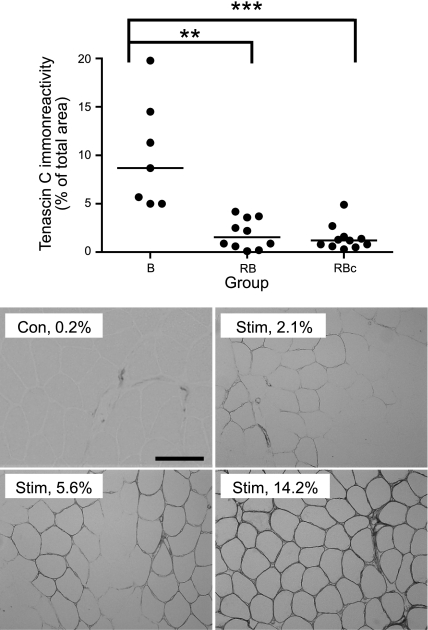
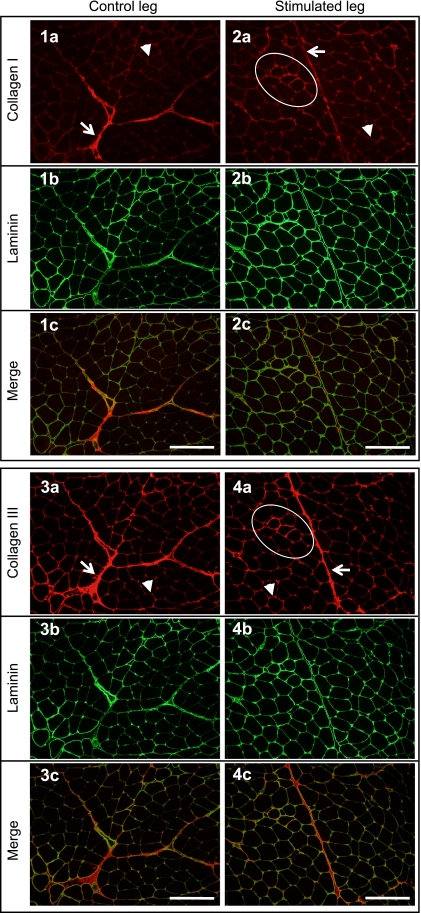
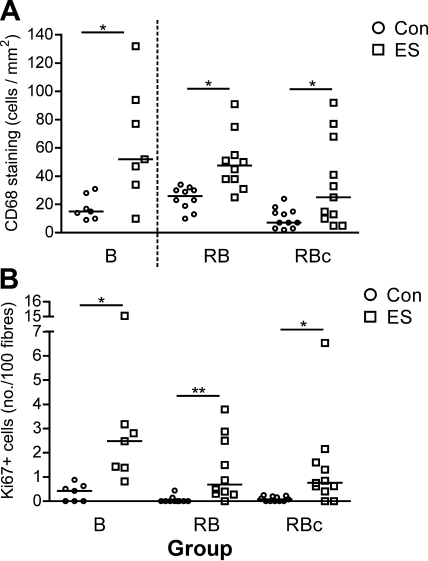
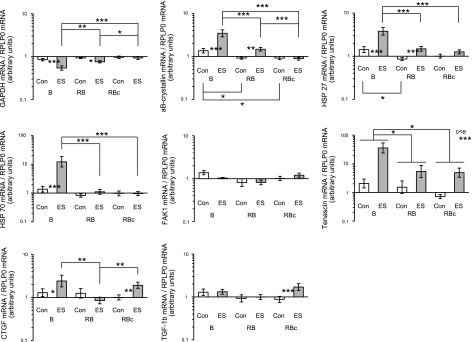
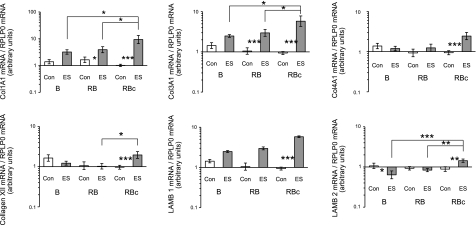
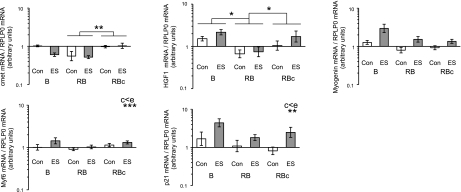
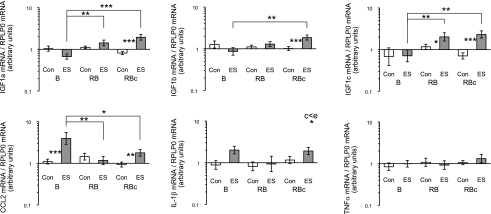
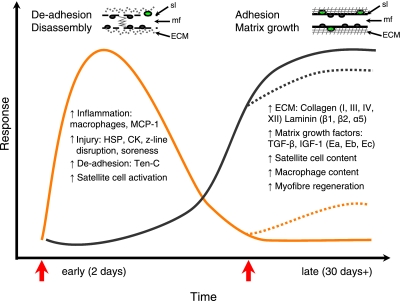
The purpose of this study was to test the hypothesis that remodeling of skeletal muscle extracellular matrix (ECM) is involved in protecting human muscle against injury. Biopsies were obtained from medial gastrocnemius muscles after a single bout of electrical stimulation (B) or a repeated bout (RB) 30 d later, or 30 d after a single stimulation bout (RBc). A muscle biopsy was collected from the control leg for comparison with the stimulated leg. Satellite cell content, tenascin C, and muscle regeneration were assessed by immunohistochemistry; real-time PCR was used to measure mRNA levels of collagens, laminins, heat-shock proteins (HSPs), inflammation, and related growth factors. The large responses of HSPs, CCL2, and tenascin C detected 48 h after a single bout were attenuated in the RB trial, indicative of protection against injury. Satellite cell content and 12 target genes, including IGF-1, were elevated 30 d after a single bout. Among those displaying the greatest difference vs. control muscle, ECM laminin-β1 and collagen types I and III were elevated ∼6- to 9-fold (P<0.001). The findings indicate that the sequenced events of load-induced early deadhesion and later strengthening of skeletal muscle ECM play a role in protecting human muscle against future injury.


Figures

Figure 1.
Figure 1.
Outline of study design and timeline indicating the time points for muscle soreness measurements, blood samples, muscle biopsies and whether groups were subjected to a single bout (B) or repeated bout (RB) of electrical stimulation (ES). RBc, control group for the RB group.
Figure 2.
Figure 2.
Immunohistochemical detection of Pax7 cells, type I myosin, and laminin on a single cross-section of regenerating healthy gastrocnemius medialis muscle 30 d after a single bout of ES (RBc group). In this series of images with an unusually high density of Pax7 cells, 8 Pax7 cells are clearly visible, 2 of which are associated with type I fibers (red) and 6 with type II fibers (unstained). Laminin staining (green) defines the fiber borders. Scale bar = 100 μm.
Figure 3.
Figure 3.
Self-assessment of muscle soreness in the days following a single bout (bout 1) or a second bout (bout 2) of stimulated muscle contractions, performed by the same individuals 1 mo after bout 1 (RB). A significant main effect of time was detected, but not bout or interaction.
Figure 4.
Figure 4.
Circulating CK activity was measured in the RB group following 2 bouts of ES-induced isometric contractions of the medial gastrocnemius muscle (A), and in the RBc group following biopsying alone (B) on d 2. Biopsies were also collected from the RB group 2 d after bout 2. Data are back-transformed geometric means with back-transformed error bars, presented on a logarithmic scale. Actual mean values for each bar are given. *P < 0.05 vs. bout 1; #P < 0.05 vs. d 0.
Figure 5.
Figure 5.
Scatter plot (with median bars) displaying the proportion of myofiber cross-sections that were positive for embryonic myosin or laminin α5, following single bout (B group) or repeated bout (RB group) of ES. Both markers of regeneration were clearly detectable in RB group and in RBc control group 30 d after a single bout. Higher values recorded for laminin α5 than embryonic myosin suggest that indications of regenerative processes are preserved in the fiber membrane for longer than in the myofibrillar component and signify that this marker is less sensitive to the number of fibers in the cross-section.
Figure 6.
Figure 6.
Five consecutive 10-μm sections (rows 1–5) of a biopsy taken 30 d after a single bout of ES-induced isometric contractions (RBc group), clearly demonstrating ongoing regeneration. Each row is a series of images of 1 double-stained section, the 2 individual stainings in the left and middle panels merged digitally in the right panel. It was observed that the areas of laminin α5+ endomysial staining exhibited other signs of regeneration, such as CD56+ fibers, a high density of CD68+ cells in the ECM, embryonic myosin (Emb Myo)+ fibers, occasional small fibers (arrowheads), and central nuclei. A laminin+ dystrophin+ membrane (arrow), observed on these serial sections to encroach into one fiber, was seen to define a separate fiber on a section deeper into the biopsy (row 6). Most of the affected fibers (asterisks) were negative for type I myosin (Myo I; row 6) and positive for type II myosin (Myo II; row 7). Lam, laminin. Scale bar = 100 μm.
Figure 7.
Figure 7.
Tenascin-C immunoreactivity. Top panel: scatter plot (with median bars) indicates significantly higher levels of tenascin-C immunoreactivity 48 h following a single bout (B group) compared to a repeated bout (RB group) of ES or the response 30 d after a single bout (RBc group). Bottom panels: images illustrate varying extents of tenascin-C immunoreactivity from control (Con) muscle and muscle subjected to ES (Stim). Percentage of immunoreactive area for each image was quantified; respective results for these representative images (a portion of each image is shown) are given. Scale bar = 200 μm. **P < 0.01, ***P < 0.001; Dunn's multiple comparison test.
Figure 8.
Figure 8.
Immunohistochemical staining pattern of collagen types I and III on cross-sections of skeletal muscle 30 d after a single bout of ES-induced isometric contractions (RBc group). Two serial sections from the stimulated and control legs of one individual were double-stained with laminin and type I (series 1 and 2) or type III (series 3 and 4) collagen. The collagen (a) and laminin (b) stainings are displayed separately and as computer-generated merged images (c). Both collagen types were observed in perimysium (arrows) and endomysium (arrowheads), with negligible staining of capillaries. Endomysium around regenerating fibers appeared to demonstrate more intense immunoreactivity for collagen types I and III (circled area). Scale bars = 200 μm.
Figure 9.
Figure 9.
Scatter plots (with median bars) displaying the number of macrophages (CD68+ cells) per square millimeter of biopsy cross-section (A) and the number of Ki67+ cells per 100 fibers (B) from electrically stimulated (ES) or control (Con) muscle. Broken vertical line in panel A indicates that biopsies in B group were subject to separate immunohistochemical and statistical analyses from RB and RBc groups. *P < 0.05; **P < 0.01.
Figure 10.
Figure 10.
Top panel: scatter plot (with median bars) displaying extent of z-line disruption (0 = none, 3 = severe disruption) following a single bout (B group) or repeated bout (RB group) of ES. Biopsies in RBc group were collected 30 d after a single bout. Bottom panels: transmission electron micrographs of longitudinal sections of human medial gastrocnemius from RBc group biopsies. Representative images from 2 subjects (Sub 1 and 2) are displayed, along with images from control (Con) legs of the same individuals. Images illustrate that, while strict z-line alignment and register have generally been restored, discrete and subtle differences are still visible at this time point. Scale bars = 1 μm. **P < 0.01; ***P < 0.001.
Figure 11.
Figure 11.
HSP and matricellular protein gene expression levels in control (Con) muscle and muscle subjected to a single bout (B group) or a repeated bout (RB group) of ES 1 mo after first bout. Biopsies in RBc group were collected 30 d after a single bout of ES. mRNA levels of GAPDH, αβ-crystallin, HSP27, HSP70, FAK1, tenascin C, CTGF and TGF-β are presented, expressed relative to RPLP0 mRNA. Data are back-transformed geometric means ± se, displayed on a logarithmic scale y axis.
Figure 12.
Figure 12.
Comparisons of extracellular matrix gene expression levels between control (Con) muscle and muscle subjected to a single bout (B group) or a repeated bout (RB group) of ES 1 mo after first bout. Biopsies in RBc group were collected 30 d after single bout of ES. mRNA levels of collagen types I (Col1A), III (Col3A1), IV (Col4A1), XII, and laminin-β1 (LAMB 1) and -β2 (LAMB 2) are presented, expressed relative to RPLP0 mRNA. Data are back-transformed geometric means ± se, displayed on a logarithmic scale y axis.
Figure 13.
Figure 13.
Comparisons of SC-related gene expression levels between control (Con) muscle and muscle subjected to a single bout (B group) or a repeated bout (RB group) of ES 1 mo after first bout. Biopsies in RBc group were collected 30 d after a single bout of ES. mRNA levels of c-met, HGF (HGF1), myogenin, Myf6 (MRF4), and p21 are presented, expressed relative to RPLP0 mRNA. Data are back-transformed geometric means ± se, displayed on a logarithmic scale y axis.
Figure 14.
Figure 14.
IGF-1 and inflammatory-related gene expression levels in control (Con) muscle and muscle subjected to a single bout (B group) or a repeated bout (RB group) of ES 1 mo after first bout. Biopsies in RBc group were collected 30 d after a single bout of ES. mRNA levels of IGF1-Ea (IGF1a), IGF1-Eb (IGF1b), IGF1-Ec (IGF1c; MGF), CCL2 (MCP-1), interleukin (Il)-1β, and tumor necrosis factor α (TNF-α) are presented, expressed relative to RPLP0 mRNA. Data are back-transformed geometric means ± se, displayed on a logarithmic scale y axis.
Figure 15.
Figure 15.
Schematic illustration of human skeletal muscle responses to damaging ES (red arrows). In response to the first bout, marked muscle damage and associated early responses are observed (orange line), followed by a delayed anabolic response of the muscle ECM (black line). This late response raises the resistance toward muscle damage and disorganization after a second repeated bout in the same muscle. Solid lines represent response to the first bout; broken lines illustrate how a repeated bout may alter this response. At top left, a muscle fiber (mf) with myonuclei (dark gray circles) and SCs (green circles) is depicted during the early response, illustrating the disorganized ECM and damage to the myofibrils and sarcolemma (sl). Myofiber at top right represents the late phase, characterized by a higher SC content, a repaired sarcolemma, and a strengthened ECM, factors that are likely to be involved in protecting the muscle from damage on exposure to subsequent injuring stimuli.

Similar articles

Cited by

References

    1. Round J. M., Jones D. A., Cambridge G. (1987) Cellular infiltrates in human skeletal muscle: exercise induced damage as a model for inflammatory muscle disease? J. Neurol. Sci. 82, 1–11 - PubMed
    1. Hikida R. S., Staron R. S., Hagerman F. C., Sherman W. M., Costill D. L. (1983) Muscle fiber necrosis associated with human marathon runners. J. Neurol. Sci. 59, 185–203 - PubMed
    1. Jones D. A., Newham D. J., Round J. M., Tolfree S. E. (1986) Experimental human muscle damage: morphological changes in relation to other indices of damage. J. Physiol. 375, 435–448 - PMC - PubMed
    1. Crameri R. M., Aagaard P., Qvortrup K., Langberg H., Olesen J., Kjaer M. (2007) Myofibre damage in human skeletal muscle: effects of electrical stimulation vs voluntary contraction. J. Physiol. (Lond.) 583, 365–380 - PMC - PubMed
    1. Mackey A. L., Bojsen-Moller J., Qvortrup K., Langberg H., Suetta C., Kalliokoski K. K., Kjaer M., Magnusson S. P. (2008) Evidence of skeletal muscle damage following electrically stimulated isometric muscle contractions in humans. J. Appl. Physiol. 105, 1620–1627 - PubMed

Publication types

MeSH terms