. 2011 Mar 8;108(10):4158-63.
doi: 10.1073/pnas.1015676108. Epub 2011 Feb 22.

Bacterial community structures are unique and resilient in full-scale bioenergy systems

Affiliations

Bacterial community structures are unique and resilient in full-scale bioenergy systems

Jeffrey J Werner et al. Proc Natl Acad Sci U S A. .

Abstract

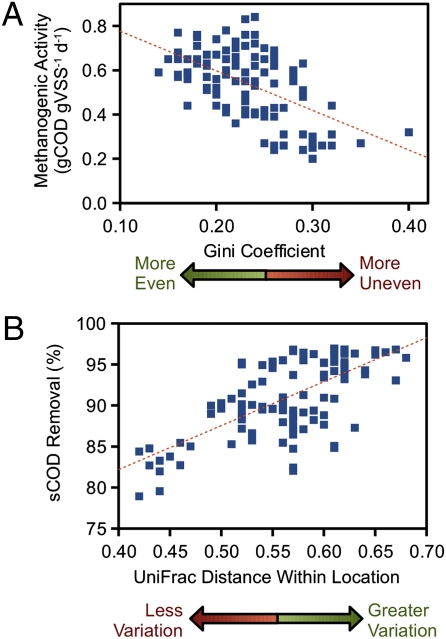
Anaerobic digestion is the most successful bioenergy technology worldwide with, at its core, undefined microbial communities that have poorly understood dynamics. Here, we investigated the relationships of bacterial community structure (>400,000 16S rRNA gene sequences for 112 samples) with function (i.e., bioreactor performance) and environment (i.e., operating conditions) in a yearlong monthly time series of nine full-scale bioreactor facilities treating brewery wastewater (>20,000 measurements). Each of the nine facilities had a unique community structure with an unprecedented level of stability. Using machine learning, we identified a small subset of operational taxonomic units (OTUs; 145 out of 4,962), which predicted the location of the facility of origin for almost every sample (96.4% accuracy). Of these 145 OTUs, syntrophic bacteria were systematically overrepresented, demonstrating that syntrophs rebounded following disturbances. This indicates that resilience, rather than dynamic competition, played an important role in maintaining the necessary syntrophic populations. In addition, we explained the observed phylogenetic differences between all samples on the basis of a subset of environmental gradients (using constrained ordination) and found stronger relationships between community structure and its function rather than its environment. These relationships were strongest for two performance variables--methanogenic activity and substrate removal efficiency--both of which were also affected by microbial ecology because these variables were correlated with community evenness (at any given time) and variability in phylogenetic structure (over time), respectively. Thus, we quantified relationships between community structure and function, which opens the door to engineer communities with superior functions.


Conflict of interest statement

The authors declare no conflict of interest.

Figures

Fig. 1.
Fig. 1.
Phylogenetic distances between samples (i.e., reactor communities) determined via UniFrac principal coordinates analysis (PCoA; average unweighted UniFrac distance matrix was calculated from 100 even rarefactions of 500 sequences per sample). (A) PCoA of all samples. (B) UniFrac data redundancy analysis constrained by the four highest-loading environment variables: methanogenic activity, soluble chemical oxygen demand (sCOD) removal efficiency, feeding rate normalized to biomass (F:M ratio), and temperature. (C) PCA of UniFrac data for direct comparison with B. Sample points formatted by facility location (E1–E4, I1, and U1–U4), sample year (’03 in 2003, others in 2007–2008), and reactor type (blue, EGSB; green, IC; black, UASB).
Fig. 2.
Fig. 2.
Time series of sequencing, performance [soluble chemical oxygen demand (sCOD) removal efficiency and effluent volatile fatty acid (VFA) concentration] and operating condition [feeding rate normalized to biomass (F:M ratio)] data variables for facility U1: (A) UniFrac distance from the location average. (B) Relative abundance of dynamic taxonomic groups (BACD, Bacteroidetes; DSRM, Desulfuromonales; SYNB, Syntrophobacterales). (C) F:M ratio. (D) sCOD removal efficiency. (E) Effluent VFA concentration. Vertical dashed lines indicate two significant disturbances in the phylogenetic community structure. Error bars on A and B represent the SD of 100 and 10 random subsamples, respectively, with 500 sequences per subsample.
Fig. 3.
Fig. 3.
Subset of OTUs (145 out of 4,962 total OTUs) selected by machine learning as predictive of location (accuracy = 0.964). (A) Heat map shows the complete time series (112 samples) ordered vertically per location with only the predictive OTUs. The sampling time progresses downward for each location (time). Each location has a unique OTU composition, sorted horizontally by a z score. Relative abundance of OTUs within in each sample are colored in yellow; absent OTUs are in dark blue. (B) Microbial composition (abundance of taxa) of each sample for the predictive OTU subset (white space in B represents the remainder of OTUs with other classification). (C) Relative over-/underrepresentation of taxa denote the change in relative abundance when comparing this predictive OTU subset to all observed OTUs for this study, to summarize taxonomic divisions that were more or less predictive (more or less stable and location specific) than the average OTU. (D) z scores quantify the predictive ability of OTUs for each location. The four samples that failed to classify correctly are marked with red asterisks.
Fig. 4.
Fig. 4.
The importance of redundancy in community function. (A) Methanogenic activity of each sample as a function of Gini coefficient (calculated from 100 rarefactions of 100 sequences each; linear regression slope = −1.8 ± 0.3 gCOD gVSS−1 d−1 SE, R2 = 0.29). (B) sCOD removal efficiency of each sampling time point as a function of the phylogenetic variation from the mean (measured as the UniFrac distance of each time point from the facility average; linear regression slope = 54 ± 6% SE, R2 = 0.45); methanogenic activity units are reported as g chemical oxygen demand (COD) methane produced per g volatile suspended solids (VSS) biomass used in the activity assay (maximum aceticlastic methanogenesis rate normalized to biomass).

References

    1. Angenent LT, Karim K, Al-Dahhan MH, Wrenn BA, Domíguez-Espinosa R. Production of bioenergy and biochemicals from industrial and agricultural wastewater. Trends Biotechnol. 2004;22:477–485. - PubMed
    1. Lettinga G. Anaerobic digestion and wastewater treatment systems. Antonie van Leeuwenhoek. 1995;67:3–28. - PubMed
    1. Leitão RC, van Haandel AC, Zeeman G, Lettinga G. The effects of operational and environmental variations on anaerobic wastewater treatment systems: A review. Bioresour Technol. 2006;97:1105–1118. - PubMed
    1. Briones A, Raskin L. Diversity and dynamics of microbial communities in engineered environments and their implications for process stability. Curr Opin Biotechnol. 2003;14:270–276. - PubMed
    1. Rivière D, et al. Towards the definition of a core of microorganisms involved in anaerobic digestion of sludge. ISME J. 2009;3:700–714. - PubMed

Publication types