

Topology of protein interaction network shapes protein abundances and strengths of their functional and nonspecific interactions
- PMID: 21368118
- PMCID: PMC3054035
- DOI: 10.1073/pnas.1009392108
Topology of protein interaction network shapes protein abundances and strengths of their functional and nonspecific interactions
Abstract
How do living cells achieve sufficient abundances of functional protein complexes while minimizing promiscuous nonfunctional interactions? Here we study this problem using a first-principle model of the cell whose phenotypic traits are directly determined from its genome through biophysical properties of protein structures and binding interactions in a crowded cellular environment. The model cell includes three independent prototypical pathways, whose topologies of protein-protein interaction (PPI) subnetworks are different, but whose contributions to the cell fitness are equal. Model cells evolve through genotypic mutations and phenotypic protein copy number variations. We found a strong relationship between evolved physical-chemical properties of protein interactions and their abundances due to a "frustration" effect: Strengthening of functional interactions brings about hydrophobic interfaces, which make proteins prone to promiscuous binding. The balancing act is achieved by lowering concentrations of hub proteins while raising solubilities and abundances of functional monomers. On the basis of these principles we generated and analyzed a possible realization of the proteome-wide PPI network in yeast. In this simulation we found that high-throughput affinity capture-mass spectroscopy experiments can detect functional interactions with high fidelity only for high-abundance proteins while missing most interactions for low-abundance proteins.
Conflict of interest statement
The authors declare no conflict of interest.
Figures
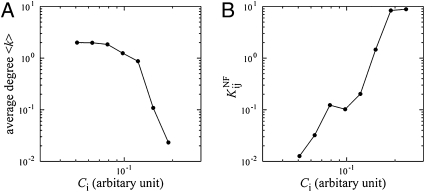
 in the functional PPI network (A) and the dissociation constants of PNF-PPI complexes,
  , which are inversely proportional to the strength of PNF-PPI (B), are plotted as a function of protein abundance,Ci.
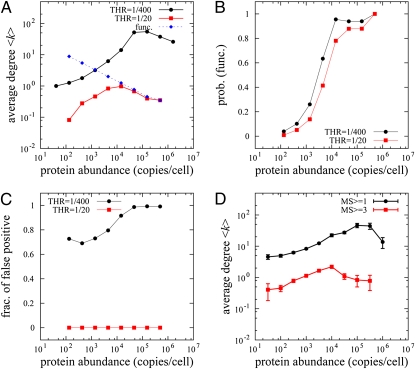
Similar articles
-
Evolution of specificity in protein-protein interactions.Biophys J. 2014 Oct 7;107(7):1686-96. doi: 10.1016/j.bpj.2014.08.004. Biophys J. 2014. PMID: 25296322 Free PMC article.
-
Human cancer protein-protein interaction network: a structural perspective.PLoS Comput Biol. 2009 Dec;5(12):e1000601. doi: 10.1371/journal.pcbi.1000601. Epub 2009 Dec 11. PLoS Comput Biol. 2009. PMID: 20011507 Free PMC article.
-
Influence of protein abundance on high-throughput protein-protein interaction detection.PLoS One. 2009 Jun 5;4(6):e5815. doi: 10.1371/journal.pone.0005815. PLoS One. 2009. PMID: 19503833 Free PMC article.
-
Protein-Protein Interactions in the Molecular Chaperone Network.Acc Chem Res. 2018 Apr 17;51(4):940-949. doi: 10.1021/acs.accounts.8b00036. Epub 2018 Apr 3. Acc Chem Res. 2018. PMID: 29613769 Free PMC article. Review.
-
Genome-wide protein interaction maps using two-hybrid systems.FEBS Lett. 2000 Aug 25;480(1):32-6. doi: 10.1016/s0014-5793(00)01774-9. FEBS Lett. 2000. PMID: 10967325 Review.
Cited by
-
Biophysics of protein evolution and evolutionary protein biophysics.J R Soc Interface. 2014 Nov 6;11(100):20140419. doi: 10.1098/rsif.2014.0419. J R Soc Interface. 2014. PMID: 25165599 Free PMC article.
-
Effect of Protein Structure on Evolution of Cotranslational Folding.Biophys J. 2020 Sep 15;119(6):1123-1134. doi: 10.1016/j.bpj.2020.06.037. Epub 2020 Aug 12. Biophys J. 2020. PMID: 32857962 Free PMC article.
-
Merging molecular mechanism and evolution: theory and computation at the interface of biophysics and evolutionary population genetics.Curr Opin Struct Biol. 2014 Jun;26:84-91. doi: 10.1016/j.sbi.2014.05.005. Epub 2014 Jun 19. Curr Opin Struct Biol. 2014. PMID: 24952216 Free PMC article. Review.
-
The Role of Evolutionary Selection in the Dynamics of Protein Structure Evolution.Biophys J. 2017 Apr 11;112(7):1350-1365. doi: 10.1016/j.bpj.2017.02.029. Biophys J. 2017. PMID: 28402878 Free PMC article.
-
A network-oriented perspective on cardiac calcium signaling.Am J Physiol Cell Physiol. 2012 Nov 1;303(9):C897-910. doi: 10.1152/ajpcell.00388.2011. Epub 2012 Jul 25. Am J Physiol Cell Physiol. 2012. PMID: 22843795 Free PMC article. Review.
References
Publication types
MeSH terms
Substances
LinkOut - more resources
Full Text Sources
Molecular Biology Databases
