

Predicting clonal self-renewal and extinction of hematopoietic stem cells
- PMID: 21368169
- PMCID: PMC3060234
- DOI: 10.1073/pnas.1011414108
Predicting clonal self-renewal and extinction of hematopoietic stem cells
Abstract
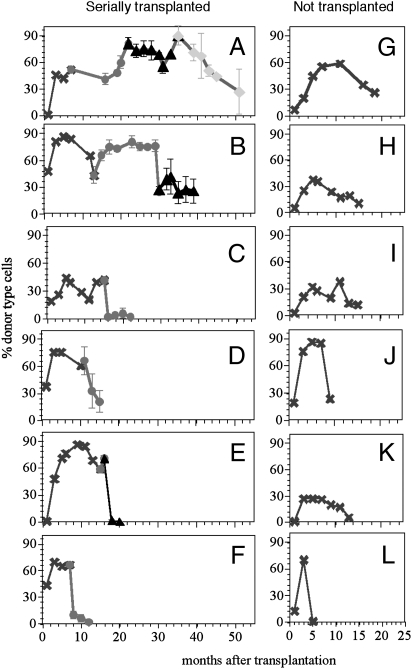
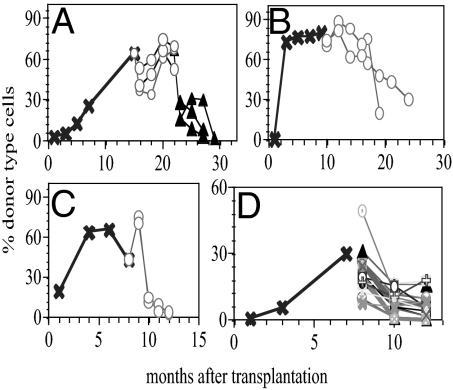
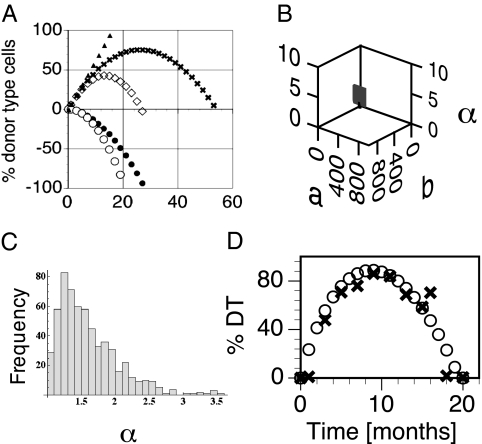
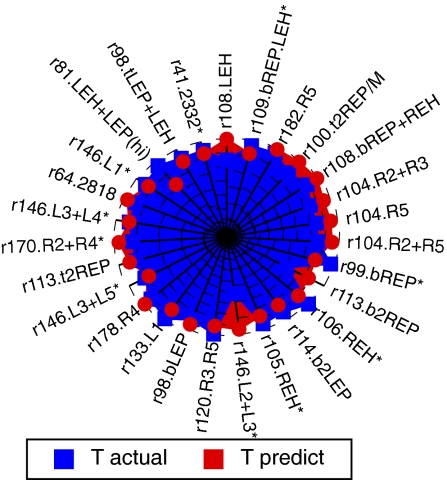
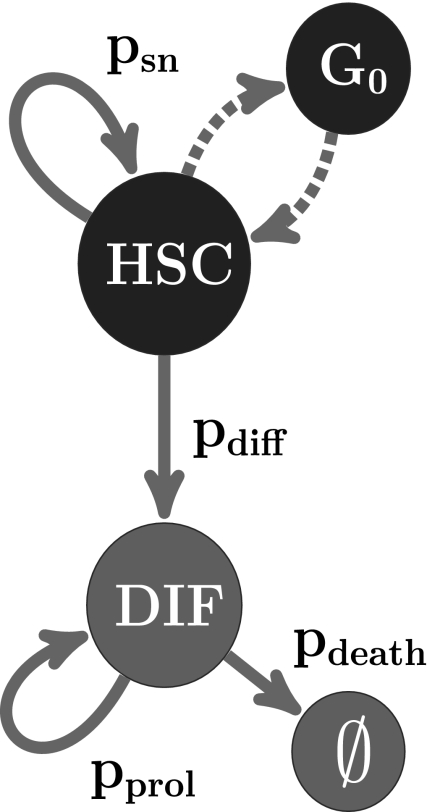
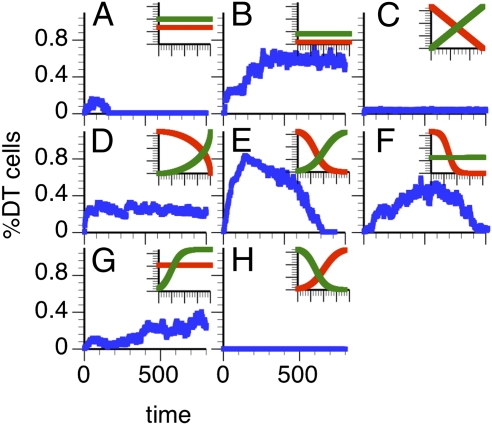
A single hematopoietic stem cell (HSC) can generate a clone, consisting of daughter HSCs and differentiated progeny, which can sustain the hematopoietic system of multiple hosts for a long time. At the same time, this massive expansion potential must be restrained to prevent abnormal, leukemic proliferation. We used an interdisciplinary approach, combining transplantation assays with mathematical and computational methods, to systematically analyze the proliferative potential of individual HSCs. We show that all HSC clones examined have an intrinsically limited life span. Daughter HSCs within a clone behaved synchronously in transplantation assays and eventually exhausted at the same time. These results indicate that each HSC is programmed to have a finite life span. This program and the memory of the life span of the mother HSC are inherited by all daughter HSCs. In contrast, there was extensive heterogeneity in life spans between individual HSC clones, ranging from 10 to almost 60 mo. We used model-based machine learning to develop a mathematical model that efficiently predicts the life spans of individual HSC clones on the basis of a few initial measurements of donor type cells in blood. Computer simulations predict that the probability of self-renewal decays with a logistic kinetic over the life span of a normal HSC clone. Other decay functions lead to either graft failure or leukemic proliferation. We propose that dynamical fate probabilities are a crucial condition that leads to self-limiting clonal proliferation.
Conflict of interest statement
The authors declare no conflict of interest.
Figures
Similar articles
-
Self-renewal of single mouse hematopoietic stem cells is reduced by JAK2V617F without compromising progenitor cell expansion.PLoS Biol. 2013;11(6):e1001576. doi: 10.1371/journal.pbio.1001576. Epub 2013 Jun 4. PLoS Biol. 2013. PMID: 23750118 Free PMC article.
-
Characterization and quantification of clonal heterogeneity among hematopoietic stem cells: a model-based approach.Blood. 2008 Dec 15;112(13):4874-83. doi: 10.1182/blood-2008-05-155374. Epub 2008 Sep 22. Blood. 2008. PMID: 18809760 Free PMC article.
-
Lifespan differences in hematopoietic stem cells are due to imperfect repair and unstable mean-reversion.PLoS Comput Biol. 2013 Apr;9(4):e1003006. doi: 10.1371/journal.pcbi.1003006. Epub 2013 Apr 18. PLoS Comput Biol. 2013. PMID: 23637582 Free PMC article.
-
Aging and Clonal Behavior of Hematopoietic Stem Cells.Int J Mol Sci. 2022 Feb 9;23(4):1948. doi: 10.3390/ijms23041948. Int J Mol Sci. 2022. PMID: 35216063 Free PMC article. Review.
-
Senescence and functional failure in hematopoietic stem cells.Exp Hematol. 2004 Nov;32(11):1025-32. doi: 10.1016/j.exphem.2004.08.001. Exp Hematol. 2004. PMID: 15539079 Review.
Cited by
-
Hematopoietic Stem Cells and Regeneration.Cold Spring Harb Perspect Biol. 2022 Aug 1;14(8):a040774. doi: 10.1101/cshperspect.a040774. Cold Spring Harb Perspect Biol. 2022. PMID: 34750175 Free PMC article. Review.
-
Cellular automata modelling of leukaemic stem cell dynamics in acute myeloid leukaemia: insights into predictive outcomes and targeted therapies.R Soc Open Sci. 2025 Jan 15;12(1):241202. doi: 10.1098/rsos.241202. eCollection 2025 Jan. R Soc Open Sci. 2025. PMID: 39816742 Free PMC article.
-
Stem cell heterogeneity: implications for aging and regenerative medicine.Blood. 2012 Apr 26;119(17):3900-7. doi: 10.1182/blood-2011-12-376749. Epub 2012 Mar 9. Blood. 2012. PMID: 22408258 Free PMC article. Review.
-
Modeling large fluctuations of thousands of clones during hematopoiesis: The role of stem cell self-renewal and bursty progenitor dynamics in rhesus macaque.PLoS Comput Biol. 2018 Oct 18;14(10):e1006489. doi: 10.1371/journal.pcbi.1006489. eCollection 2018 Oct. PLoS Comput Biol. 2018. PMID: 30335762 Free PMC article.
-
Proteinase 3 Limits the Number of Hematopoietic Stem and Progenitor Cells in Murine Bone Marrow.Stem Cell Reports. 2018 Nov 13;11(5):1092-1105. doi: 10.1016/j.stemcr.2018.10.004. Epub 2018 Nov 1. Stem Cell Reports. 2018. PMID: 30392974 Free PMC article.
References
-
- Jordan CT, Lemischka IR. Clonal and systemic analysis of long-term hematopoiesis in the mouse. Genes Dev. 1990;4:220–232. - PubMed
-
- Osawa M, Hanada K, Hamada H, Nakauchi H. Long-term lymphohematopoietic reconstitution by a single CD34-low/negative hematopoietic stem cell. Science. 1996;273:242–245. - PubMed
-
- Müller-Sieburg CE, Cho RH, Thoman M, Adkins B, Sieburg HB. Deterministic regulation of hematopoietic stem cell self-renewal and differentiation. Blood. 2002;100:1302–1309. - PubMed
Publication types
MeSH terms
Grants and funding
LinkOut - more resources
Full Text Sources
Other Literature Sources
Medical
