. 2011 Mar 15;108(11):4423-8.
doi: 10.1073/pnas.1015904108. Epub 2011 Feb 28.

Reassessing optimal neural population codes with neurometric functions

Affiliations

Reassessing optimal neural population codes with neurometric functions

Philipp Berens et al. Proc Natl Acad Sci U S A. .

Abstract

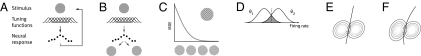
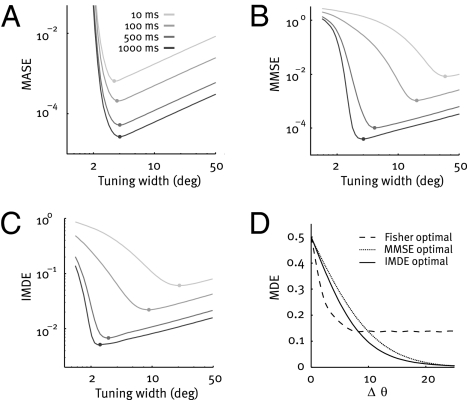
Cortical circuits perform the computations underlying rapid perceptual decisions within a few dozen milliseconds with each neuron emitting only a few spikes. Under these conditions, the theoretical analysis of neural population codes is challenging, as the most commonly used theoretical tool--Fisher information--can lead to erroneous conclusions about the optimality of different coding schemes. Here we revisit the effect of tuning function width and correlation structure on neural population codes based on ideal observer analysis in both a discrimination and a reconstruction task. We show that the optimal tuning function width and the optimal correlation structure in both paradigms strongly depend on the available decoding time in a very similar way. In contrast, population codes optimized for Fisher information do not depend on decoding time and are severely suboptimal when only few spikes are available. In addition, we use the neurometric functions of the ideal observer in the classification task to investigate the differential coding properties of these Fisher-optimal codes for fine and coarse discrimination. We find that the discrimination error for these codes does not decrease to zero with increasing population size, even in simple coarse discrimination tasks. Our results suggest that quite different population codes may be optimal for rapid decoding in cortical computations than those inferred from the optimization of Fisher information.


Conflict of interest statement

The authors declare no conflict of interest.

Figures

Fig. 1.
Fig. 1.
(A) The stimulus reconstruction framework. Orientation is represented in the noisy firing rates of a population of neurons. The error of estimating this stimulus orientation optimally from the firing rates serves as a measure of coding accuracy. (B) The stimulus discrimination framework. The error of an optimal classifier deciding whether a noisy rate profile was elicited by stimulus 1 or 2 is taken as a measure of coding accuracy. (C) A neurometric function is a graph of the minimum discrimination error (MDE) as a function of the difference between a fixed reference orientation (upper right) and a second varied stimulus orientation (x axis). (D) The MDE for two Gaussian firing rate distributions with different mean rates corresponds to the gray area. The optimal classifier selects the stimulus more likely to have caused the observed firing rate. (E) The optimal discrimination function in the case of two neurons, whose firing rates are described by a bivariate Gaussian distribution, is a straight line if the stimulus change causes only a change in the mean. (F) If it also changes the covariance matrix, the optimal discrimination function is quadratic.
Fig. 2.
Fig. 2.
Optimal tuning function width. (A) Mean asymptotic error (MASE) of a population of 100 independent neurons as a function of tuning width for four different integration times (T = 10, 100, 500, and 1,000 ms; light gray to black). The MASE is the average inverse Fisher information. Dots mark the optimum. (B) As in A, but MMSE of the same population. For short integration times, broad tuning functions are optimal in terms of MMSE, in striking contrast to the predictions based on Fisher information. (C) As in A, but IMDE of the same population. Results obtained with the IMDE agree well with those based on the MMSE, although the former corresponds to the minimal error in a discrimination task and the latter to that in a reconstruction task. (D) Neurometric function of a population with Fisher-optimal (dashed line), MMSE-optimal (dotted line), and IMDE-optimal tuning width (solid line) for a short time interval (10 ms).
Fig. 3.
Fig. 3.
Performance of Fisher-optimal codes. (A) Optimal tuning width as a function of population size for T = 1,000 ms. (B) MASE of a neural population with independent noise and Fisher-optimal width for 10 different integration times T (values logarithmically spaced between 10 and 1,000; light to dark gray). The width of the tuning functions is optimized for each N separately and chosen such that it minimizes the MASE. (C) IMDE for the same Fisher-optimal populations as in B. (D) Family of neurometric functions for Fisher-optimal population codes at T = 10 ms for n = 10 to n = 190 (right to left). ΔθS is the point of saturation, and P is the pedestal error, also marked by the gray dashed line. (E) The pedestal error P is independent of the population size N (T = 1,000 ms not shown for clarity). (F) The pedestal error P depends on the integration time (black; independent of N) and analytical approximation for P (gray). (G) For each population size, approximately three neurons are activated by each stimulus (red), independent of the population size. (H) For coarse discrimination (red vs. green), the two stimuli activate disjoint sets of neurons determining the pedestal error (red vs. green; error bars show 2 SD). For fine discrimination, the activated populations overlap, determining the initial region (red vs. blue). (I) Dependence of the point of saturation ΔθS on the population size N. (J) Two parts of the neurometric function of Fisher-optimal population codes: the pedestal error P (light gray) and the initial region (dark gray). Together they determine the IMDE. The neurometric function is shown in units of difference in preferred orientation; therefore it does not depend on N. The pedestal error is reached at ΔθS ~ 2Δφ (Fig. S4). As N → ∞, the x axis is rescaled and the area of the initial region AIR goes to zero (SI Text) and the IMDE converges to πP.
Fig. 4.
Fig. 4.
Effect of noise correlations. (A) Correlation coefficient matrices. Dark values indicate high correlations. Neurons are arranged according to their preferred orientation, so correlations between cells with similar tuning properties are close to the main diagonal. Diagonal entries have been removed for visualization. (B–D) MASE, MMSE, and IMDE for a population of n = 100 neurons for the four different noise correlation structures shown relative to the independent population in logarithmic units. Colors are as shown in A. (E and F) MASE (dashed lines) and IMDE (solid lines) for a population of 100 neurons with stimulus-dependent (red) or uniform correlations (blue) at 500 ms (E) and 10 ms (F) as a function of average correlation strength. Data are shown relative to the independent population in logarithmic units. (G and H) Neurometric functions for the four correlation structures at 500 ms (G) and at 10 ms (H). The square marks Δθc; from there on stimulus-dependent correlations perform worse than uniform correlations. In H, the crossing point lies effectively at Δθ = 0. Data are also shown relative to the independent population, smoothed and in logarithmic units on the y axis in the Insets.

References

    1. Pouget A, Dayan P, Zemel RS. Inference and computation with population codes. Annu Rev Neurosci. 2003;26:381–410. - PubMed
    1. Oram MW, Földiák P, Perrett DI, Sengpiel F. The ‘Ideal Homunculus’: decoding neural population signals. Trends Neurosci. 1998;21:259–265. - PubMed
    1. Geisler WS. Ideal observer analysis. In: Chalupa L, Werner J, editors. The Visual Neurosciences. Boston: MIT Press; 2003. pp. 825–837.
    1. Seung HS, Sompolinsky H. Simple models for reading neuronal population codes. Proc Natl Acad Sci USA. 1993;90:10749–10753. - PMC - PubMed
    1. Abbott LF, Dayan P. The effect of correlated variability on the accuracy of a population code. Neural Comput. 1999;11:91–101. - PubMed

Publication types

LinkOut - more resources