. 2011 Mar 15;108(11):4494-9.
doi: 10.1073/pnas.1019751108. Epub 2011 Feb 28.

Neisseria meningitidis is structured in clades associated with restriction modification systems that modulate homologous recombination

Affiliations

Neisseria meningitidis is structured in clades associated with restriction modification systems that modulate homologous recombination

Sonia Budroni et al. Proc Natl Acad Sci U S A. .

Abstract

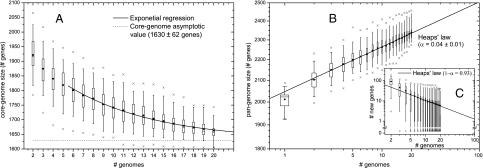
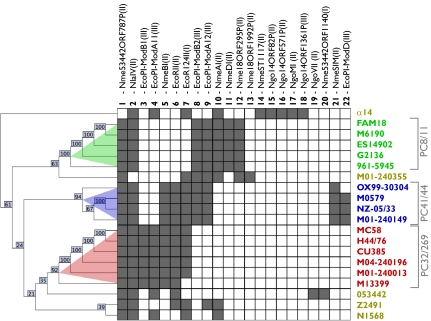
Molecular data on a limited number of chromosomal loci have shown that the population of Neisseria meningitidis (Nm), a deadly human pathogen, is structured in distinct lineages. Given that the Nm population undergoes substantial recombination, the mechanisms resulting in the evolution of these lineages, their persistence in time, and the implications for the pathogenicity of the bacterium are not yet completely understood. Based on whole-genome sequencing, we show that Nm is structured in phylogenetic clades. Through acquisition of specific genes and through insertions and rearrangements, each clade has acquired and remodeled specific genomic tracts, with the potential to impact on the commensal and virulence behavior of Nm. Despite this clear evidence of a structured population, we confirm high rates of detectable recombination throughout the whole Nm chromosome. However, gene conversion events were found to be longer within clades than between clades, suggesting a DNA cleavage mechanism associated with the phylogeny of the species. We identify 22 restriction modification systems, probably acquired by horizontal gene transfer from outside of the species/genus, whose distribution in the different strains coincides with the phylogenetic clade structure. We provide evidence that these clade-associated restriction modification systems generate a differential barrier to DNA exchange consistent with the observed population structure. These findings have general implications for the emergence of lineage structure and virulence in recombining bacterial populations, and they could provide an evolutionary framework for the population biology of a number of other bacterial species that show contradictory population structure and dynamics.


Conflict of interest statement

Conflict of interest statement: M.C., A.C., M.P., R.R., D.S., K.L.S., and D.M. are employees of Novartis Vaccines; S.B. and E.S. have PhD grants from Novartis Vaccines; and E.R.M. serves on the Scientific Advisory Board of Novartis Vaccines.

Figures

Fig. 1.
Fig. 1.
Nm pan-genome analysis. For each distribution of values in the pan-genome sampling process, box plots represent medians and interquartile ranges, whiskers are the central 95% percentile ranges, minimums and maximums are marked with an “x,” and the means are circles. (A) The number of core genes is plotted vs. the number of genomes evaluated. The curve represents the least-square regression of an exponential decay function to the data for more than five genomes; the dashed line indicates the asymptotic value predicted for the core genome: 1,630 genes. (B) The pan-genome size is plotted vs. the number of genomes evaluated. The curve represents the least-square regression of a Heaps law function to the data obtained for α = 0.04 ± 0.01. (C) The number of genes discovered is plotted vs. the number of genomes investigated. The curve represents the least-square fit of a power-law function to the data obtained for (1 − α) = 0.93 in good agreement with the pan-genome regression.
Fig. 2.
Fig. 2.
Phylogenetic network for Nm core genome. NeighborNet phylogenetic network obtained for the Nm core genome. PCs are color-coded in blue (PC41/44), green (PC8/11), and red (PC32/269). Strains not clustering into phylogenetic groups are shown in yellow. Colored boxes report, for each PC, the main properties of PC-specific DNA insertions. The box in the bottom right corner reports, for each PC and CC, the percentage of nucleotide identity (average ± SD) and the number of specific genes. The box in the bottom left corner reports the main properties of CC- and PC-specific rearrangements, which are mapped as circular arrows on the phylogeny. Details on DNA insertions and rearrangements are provided in SI Results, where each event is identified by the same label as reported here.
Fig. 3.
Fig. 3.
Presence/absence of 22 RMSs reconstructs PCs. A presence/absence matrix is shown, where each row represents one Nm genome analyzed, color-coded as in Fig. 2, and each column represents 1 of 22 RMSs identified (Table S2). Presence of an RMS in a strain is indicated by a dark square. The cladogram is a bootstrapped agglomerative hierarchical clustering of strains based on RMS presence/absence, and numbers indicate bootstrap support for each node. Color shades on the cladogram indicate support groups obtained with a distance threshold of one RMS.
Fig. 4.
Fig. 4.
Length of predicted gene conversion events within and between PCs. (A) Reverse cumulative distribution of gene conversion events for various lengths of the exchanged DNA (i.e., the proportion of events equal or longer than the length indicated on the x axis). Within PC events (donor and acceptor in the same PC) are shown as open squares. Between PC events (donor and acceptor in different PCs) are shown as circles. (B) Linkage disequilibrium measure D′ (SI Materials and Methods) as a function of the physical distance along the chromosome: within PC (B1) and between PC (B2). Solid curves indicate least-square regression of the exponential decay function κ × exp(−x/τ) + δ to the data. Best fits were obtained for 3τ = 2,430 (within PC) and 3τ = 729 (between PC), where 3τ is an approximate estimate of the average length of gene conversion events. Dashed lines indicate best-fit values for δ.
Fig. 5.
Fig. 5.
Working model for RMS-driven origin and persistence of PCs in Nm (in the text).

Similar articles

Cited by

References

    1. Stephens DS, Greenwood B, Brandtzaeg P. Epidemic meningitis, meningococcaemia, and Neisseria meningitidis. Lancet. 2007;369:2196–2210. - PubMed
    1. Maiden MC. Population structure of Neisseria meningitidis. In: Ferreirós C, Criado MT, Vázquez J, editors. Emerging Strategies in the Fight Against Meningitis: Molecular and Cellular Aspects. Wymondham, Norfolk, United Kingdom: Horizon Scientific Press; 2002. pp. 151–170.
    1. Snyder LA, Saunders NJ. The majority of genes in the pathogenic Neisseria species are present in non-pathogenic Neisseria lactamica, including those designated as ‘virulence genes.’. BMC Genomics. 2006;7:128–139. - PMC - PubMed
    1. Bille E, et al. Association of a bacteriophage with meningococcal disease in young adults. PLoS ONE. 2008;3:e3885. - PMC - PubMed
    1. Dunning Hotopp JC, et al. Comparative genomics of Neisseria meningitidis: Core genome, islands of horizontal transfer and pathogen-specific genes. Microbiology. 2006;152:3733–3749. - PubMed

MeSH terms

Substances

LinkOut - more resources