. 2011 Mar 15;108(11):4340-5.
doi: 10.1073/pnas.1011115108. Epub 2011 Feb 23.

Signaling by vitamin A and retinol-binding protein regulates gene expression to inhibit insulin responses

Affiliations

Signaling by vitamin A and retinol-binding protein regulates gene expression to inhibit insulin responses

Daniel C Berry et al. Proc Natl Acad Sci U S A. .

Abstract

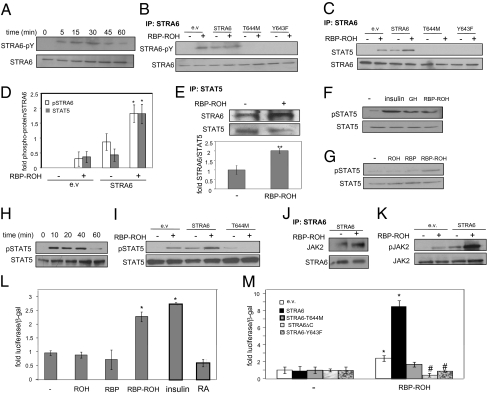
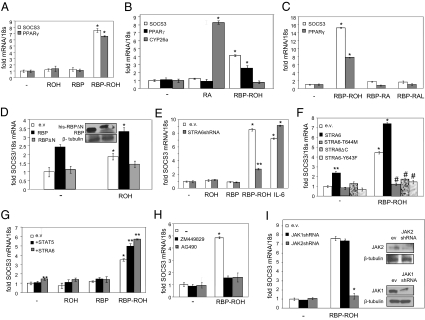
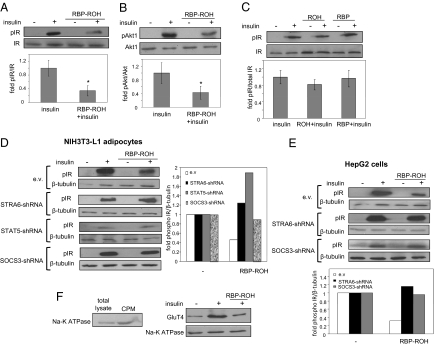
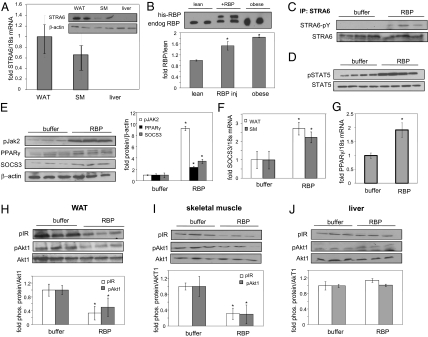
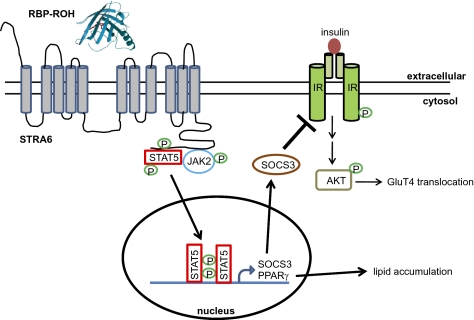
It currently is believed that vitamin A, retinol, functions through active metabolites: the visual chromophore 11-cis-retinal, and retinoic acids, which regulate gene transcription. Retinol circulates in blood bound to retinol-binding protein (RBP) and is transported into cells by a membrane protein termed "stimulated by retinoic acid 6" (STRA6). We show here that STRA6 not only is a vitamin A transporter but also is a cell-surface signaling receptor activated by the RBP-retinol complex. Association of RBP-retinol with STRA6 triggers tyrosine phosphorylation, resulting in recruitment and activation of JAK2 and the transcription factor STAT5. The RBP-retinol/STRA6/JAK2/STAT5 signaling cascade induces the expression of STAT target genes, including suppressor of cytokine signaling 3 (SOCS3), which inhibits insulin signaling, and peroxisome proliferator-activated receptor gamma (PPARγ), which enhances lipid accumulation. These observations establish that the parental vitamin A molecule is a transcriptional regulator in its own right, reveal that the scope of biological functions of the vitamin is broader than previously suspected, and provide a rationale for understanding how RBP and retinol regulate energy homeostasis and insulin responses.


Conflict of interest statement

The authors declare no conflict of interest.

Figures

Fig. 1.
Fig. 1.
RBP-ROH induces STRA6 phosphorylation, triggering recruitment and activation of JAK2 and STAT5. (A) HepG2 cells were transfected with a vector harboring STRA6. Cells were treated with RBP-ROH (1 μM) 24 h after transfection and lysed at denoted times. STRA6 was immunoprecipitated, and precipitates were blotted for phosphor-tyrosine. (B) HepG2 cells were transfected as denoted. Similar overexpression of proteins was verified for (Fig. S2A). Cells were treated with RBP-ROH (1 μM; 15 min), STRA6-immunoprecipitated, and blotted for phospho-tyrosine. (C) HepG2 cells were transfected as denoted. STRA6 precipitated, and precipitates were blotted as indicated. (D) Quantification of bands in B and C in three independent experiments. (*P = 0.05 vs. STRA6-transfected nontreated cells.) (E) (Upper) HepG2 cells were treated as denoted, STAT5 immunoprecipitated, and precipitates blotted for STRA6 and total STAT5. (Lower) Quantification of bands in three independent experiments. (**P = 0.01.) (F) HepG2 cells were treated with insulin (15 min, 25 nM), growth hormone (GH, 500 ng), or RBP-ROH. Lysates were immunoblotted for phosphorylated STAT5 (pSTAT5, Y694) and total STAT5. (G) HepG2 cells were treated with denoted ligands (1 μM; 15 min), and lysates blotted for denoted proteins. (H) Cells were treated with RBP-ROH and lysates blotted for pSTAT5 (pY694) and total STAT5. (I) Cells were transfected as denoted and treated with RBP-ROH (1 μM; 15 min) and lysates were immunoblotted as denoted. (J) HepG2 cells were transfected with a STRA6-encoding vector, treated with RBP-ROH (1 μM; 15 min), lysed, and STRA6 was immunoprecipitated. Precipitates were immunoblotted for JAK2. (K) HepG2 cells were transfected as denoted, treated with RBP-ROH (1 μM; 15 min), lysed, and immunoblotted for pJAK2 (Y1007/1008) and total JAK2. (L and M) HepG2 cells were cotransfected with a luciferase reporter driven by STAT response elements and an expression vector for β-galactosidase. (L) Cells were treated with denoted ligands (1 μM), or insulin (5 nM). Cells were lysed 25 h later, and luciferase activity was measured and normalized to β-galactosidase. (mean ± SEM; *P < 0.02 vs. nontreated controls; n = 3.) (M) Transactivation assays using cells transfected with denoted vectors. Cells were treated with RBP-ROH for 24 h, and luciferase activity was normalized to β-galactosidase. (mean ± SEM; *P < 0.02 vs. nontreated controls; #P < 0.05 vs. RBP-ROH–treated cells transfected with an empty vector; n = 3.)
Fig. 2.
Fig. 2.
RBP-ROH activates STAT in a STRA6- and JAK2-mediated fashion. (A) HepG2 cells were treated with denoted ligands (1 μM; 4 h). SOCS3 and PPARγ mRNA were measured by qPCR. (mean ± SEM; *P < 0.01 vs. nontreated controls; n = 3.) (B) HepG2 cells were treated with RBP-ROH or RA (1 μM; 4 h). mRNA for SOCS3, PPARγ, and CYP26a were measured by qPCR. (mean ± SEM; *P < 0.02 vs. nontreated controls; n = 3.) (C) Cells were treated with denoted ligands (1 μM; 4 h). mRNA for SOCS3 and PPARγ were measured by qPCR. (mean ± SEM; *P < 0.01 vs. nontreated controls; n = 3.) (D) Cells were transfected with expression vectors for RBP or histidine-tagged RBP lacking its secretion signal (his-RBPΔN). Cells were treated with vehicle or ROH (1 μM; 4 h), and SOCS3 mRNA was measured by qPCR. (mean ± SEM; *P < 0.01 vs. corresponding nontreated controls; n = 3.) (Inset) Immunoblots demonstrating overexpression of denoted proteins. (E) Cells were transduced as denoted. Down-regulation of STRA6 was verified by qPCR (Fig. S1G). Forty-eight hours later, cells were treated with ROH, RBP, RBP-ROH (1 μM), or IL-6 (5 ng) for 4 h. SOCS3 mRNA was measured by qPCR. (mean ± SEM; *P < 0.01 vs. nontreated controls; **P < 0.02 vs. RBP-ROH–treated cells transfected with empty vector; n = 3.) (F) HepG2 cells were transfected as denoted. Similar overexpression of proteins was verified by immunoblots (Fig. S2A). Cells were treated with RBP-ROH (1 μM; 4 h). (mean ± SEM; *P < 0.01 vs. nontreated controls; **P < 0.05 vs. nontreated cells transfected with empty vector; #P < 0.05 vs. RBP-ROH–treated cells transfected with empty vector; n = 3.) (G) Cells were transfected as denoted. Overexpression was verified by qPCR (Fig. S1F). Cells were treated with denoted ligands (1 μM; 4 h) 48 h after transfection. SOCS3 mRNA was measured. (Mean ± SEM; *P < 0.05 vs. nontreated cells transfected with empty vector; **P < 0.05 vs. RBP-ROH–treated cells transfected with empty vector; n = 3.) (H) Cells were pretreated with the JAK inhibitors AG490 or ZM449829 (50 μM) for 24 h and then were treated with RBP-ROH (1 μM; 4 h). SOCS3 mRNA was measured. (Mean ± SEM; *P < 0.01 vs. nontreated cells; n = 3.) (I) Cells were transfected with an empty lentiviral vector or a lentiviral vector harboring denoted shRNAs. Cells were treated with RBP-ROH (1 μM; 4 h) 48 h later. SOCS3 mRNA was measured (mean ± SEM; *P < 0.01 vs. RBP-ROH–treated cells transfected with empty vector; n = 3.) (Insets) Immunoblots demonstrating down-regulation of JAKs.
Fig. 3.
Fig. 3.
The RBP-ROH/STRA6/STAT5 pathway impairs insulin responses. (A and B) Differentiated adipocytes were treated with insulin (20 nM; 25 min) or RBP-ROH (1 μM; 8 h) or were pretreated with RBP-ROH for 8 h before treatment with insulin. (Upper) Lysates were immunoblotted for phosphorylated insulin receptor (pIR-Y1146) and total insulin receptor (IR) (A) or phosphorylated Akt (pAkt1-S473) and total Akt1 (B). (Lower) Quantification of phosphorylated/total proteins. (Data shown are mean ± SEM; #P < 0.02 vs. controls not pretreated with RBP-ROH; n = 3. (C) Differentiated adipocytes were treated with ROH or RBP (1 μM; 8 h) and then were treated with insulin (20 nM; 25 min.). (Upper) Lysates were immunoblotted as denoted. (Lower) Quantification of immunoblots. (Data shown are mean ± SEM; n = 3.) (D and E) Differentiated adipocytes (D) or HepG2 cells (E) were transduced for 5 d with lentiviruses harboring the denoted shRNAs. Decreased expression of target proteins was verified by qPCR and/or immunoblots (Figs. S3E, S4B, and S5 C and D). Cells were treated with insulin (20 nM; 25 min) or RBP-ROH (1 μM; 8 h) or were pretreated with RBP-ROH for 8 h before treatment with insulin. Lysates were immunoblotted as denoted in left panel in D and upper panel in E. Experiments were performed twice with similar results. Right panel in D and lower panel in E show quantification of data, mean of two independent experiments. (F) Differentiated adipocytes were treated with vehicle or insulin (20 nM; 25 min) or were pretreated with RBP-ROH (1 μM; 8 h) before treatment with insulin. Crude plasma membrane fractions (cpm) were obtained (27). (Left) Immunoblots showing enrichment of Na-K ATPase in cpm. (Right) Immunoblots of GluT4 in cpm. The plasma membrane marker Na-K ATPase served as a loading control.
Fig. 4.
Fig. 4.
RBP triggers phosphorylation of STRA6, STAT5, and JAK2, up-regulates the expression of STAT target genes, and represses insulin signaling in vivo. (A) STRA6 mRNA in white adipose tissue (WAT), skeletal muscle (SM), and liver, measured by qPCR. (Data shown are mean ± SEM in three mice.) (Inset) Immunoblots of STRA6 in white adipose tissue, skeletal muscle, and liver in two mice. (B) (Upper) Immunoblots of serum RBP in lean and obese mice and in lean mice injected with RBP. Results from two animals per group are shown. (Lower) Quantification of RBP in plasma. (Data shown are mean ± SEM; *P < 0.03 vs. lean mice; n = 3 mice per group.) (C) STRA6 was immunoprecipitated (IP) from white adipose tissue of three control (buffer) and three RBP-injected mice and immunoblotted for phospho-tyrosine. (D) Immunoblots of pSTAT5 and total STAT5 in white adipose tissue from four control (buffer) and four RBP-injected mice. (E) (Left) Immunoblots of pJAK2, PPARγ, and SOCS3 in WAT from three control (buffer) and three RBP-injected mice. (Right) Quantification of denoted protein normalized to β-actin. (*P < 0.05 vs. buffer-injected controls.) (F) SOCS3 mRNA in white adipose tissue and skeletal muscle of control (buffer) and RBP-injected mice. (Data shown are mean ± SEM; *P < 0.05 vs. buffer-injected mice; n = 3 per group.) (G) PPARγ mRNA in white adipose tissue of mice injected with buffer or RBP. (Data shown are mean ± SEM; *P < 0.05 vs. buffer-injected mice; n = 4 per group.) (HJ) (Upper) Phosphorylation levels of insulin receptor and Akt1 in white adipose tissue (H), skeletal muscle (I), and liver (J) in mice injected with buffer or RBP. (Lower) Quantification of band intensities normalized to total Akt1. (Data shown are mean ± SEM; *P < 0.05; n = 3 per group.)
Fig. 5.
Fig. 5.
Model of the RBP-ROH/STRA6/JAK/STAT pathway. Binding of RBP-ROH to the extracellular moiety of STRA6 triggers tyrosine phosphorylation within an SH2 domain-binding motif in the receptor's cytosolic domain. Phosphorylated STRA6 recruits and activates JAK2, which, in turn, phosphorylates STAT5. Activated STAT5 translocates to the nucleus to regulate the expression of target genes, including SOCS3, which inhibits insulin signaling, and PPARγ, which enhances lipid accumulation. The model of STRA6 (GeneID 64220RBP) was generated using software http://bp.nuap.nagoya-u.ac.jp/sosui. The 3D structure of holo-RBP (GenBank accession no. DAA14765.1) was solved as described in ref. .

Similar articles

Cited by

References

    1. McCollum EV, Davis M. The necessity of certain lipins in the diet during growth. J Biol Chem. 1913;15:167–175. - PubMed
    1. Osborne TB, Mendel LB. The vitamins in green foods. J Biol Chem. 1919;37:187–200.
    1. Noy N. In: Vitamin A Biochemical, Physiological, and Molecular Aspects of Human Nutrition. 2nd Ed. Stipanuk MH, editor. St. Louis: Saunders Elsevier; 2006.
    1. Schug TT, Berry DC, Shaw NS, Travis SN, Noy N. Opposing effects of retinoic acid on cell growth result from alternate activation of two different nuclear receptors. Cell. 2007;129:723–733. - PMC - PubMed
    1. Noy N. Retinoid-binding proteins: Mediators of retinoid action. Biochem J. 2000;348:481–495. - PMC - PubMed

Publication types