. 2011 Mar 15;108(11):4352-7.
doi: 10.1073/pnas.1016106108. Epub 2011 Feb 23.

Niche of harmful alga Aureococcus anophagefferens revealed through ecogenomics

Affiliations

Niche of harmful alga Aureococcus anophagefferens revealed through ecogenomics

Christopher J Gobler et al. Proc Natl Acad Sci U S A. .

Abstract

Harmful algal blooms (HABs) cause significant economic and ecological damage worldwide. Despite considerable efforts, a comprehensive understanding of the factors that promote these blooms has been lacking, because the biochemical pathways that facilitate their dominance relative to other phytoplankton within specific environments have not been identified. Here, biogeochemical measurements showed that the harmful alga Aureococcus anophagefferens outcompeted co-occurring phytoplankton in estuaries with elevated levels of dissolved organic matter and turbidity and low levels of dissolved inorganic nitrogen. We subsequently sequenced the genome of A. anophagefferens and compared its gene complement with those of six competing phytoplankton species identified through metaproteomics. Using an ecogenomic approach, we specifically focused on gene sets that may facilitate dominance within the environmental conditions present during blooms. A. anophagefferens possesses a larger genome (56 Mbp) and has more genes involved in light harvesting, organic carbon and nitrogen use, and encoding selenium- and metal-requiring enzymes than competing phytoplankton. Genes for the synthesis of microbial deterrents likely permit the proliferation of this species, with reduced mortality losses during blooms. Collectively, these findings suggest that anthropogenic activities resulting in elevated levels of turbidity, organic matter, and metals have opened a niche within coastal ecosystems that ideally suits the unique genetic capacity of A. anophagefferens and thus, has facilitated the proliferation of this and potentially other HABs.


Conflict of interest statement

The authors declare no conflict of interest.

Figures
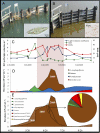
Fig. 1.
Fig. 1.
Field observations from Quantuck Bay, NY. (A) Macro- and microscopic images (Inset) of an estuary (Quantuck Bay, NY) under normal conditions on June 9, 2009 before a brown tide (note the diatom in Inset micrograph image). (B) Similar macro- and microscopic images (Inset) taken July 6, 2009 during a harmful brown tide bloom caused by A. anophagefferens (note the dominance of A. anophagefferens in Inset micrograph). (C) The dynamics of dissolved inorganic nitrogen (DIN) and dissolved organic nitrogen (DON) and the extinction coefficient of light within seawater during the spring and summer of 2009 in Quantuck Bay. (D) The dynamics of phytoplankton during the spring and summer of 2009, a year when A. anophagefferens bloomed almost to the exclusion of other phytoplankton, including picoeukaryotes, which are often dominated by Ostreococcus sp. in estuaries that host brown tides (–8), and Thalassiosira and Phaeodactylum, genera that are found in this system (6). The shaded regions in C and D indicate the period when A. anophagefferens blooms, highlighting that A. anophagefferens blooms when levels of DIN and light levels are low and DON levels are high and also highlighting that A. anophagefferens blooms can persist for more than 1 mo during the summer when this species dominates phytoplankton biomass inventories. (E) The dynamics of A. anophagefferens cell densities during 2007, 2008, and 2009, with the dates of samples collected for metaproteome analyses (June 26, 2007 and July 9, 2007) indicated within the dashed circled. Inset metaproteome pie chart specifically depicts the mean relative abundance of unique spectral counts of peptides matching proteins from A. anophagefferens, P. tricornutum (9), T. pseudonana (10), O. tauri (11), O. lucimarinus (11), Synechococcus (CC9311) (12), Synechococcus (CC9902), and heterotrophic bacteria.
Fig. 2.
Fig. 2.
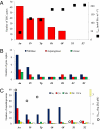
Comparisons of gene compliment between A. anophagefferens and other co-occurring phytoplankton species. Aa, A. anophagefferens; Pt, P. tricornutum; Tp, T. pseudonana; Ot, O. tauri; Ol, O. lucimarinus; S1, Synechococcus clone CC9311; S2, Synechococcus clone CC9902. (A) The number of light-harvesting complex (LHC) genes present in each phytoplankton genome (red bars; left axis) and Imax, the irradiance level required to achieve maximal growth rates in each phytoplankton (black squares; right axis) are shown. Among these species, A. anophagefferens possesses the greatest number of LHC genes, achieves a maximal growth rate at the lowest level of light, and blooms when light levels are low. (B) The number of genes associated with the degradation of nitriles, asparagine, and urea in each phytoplankton genome. A. anophagefferens grows efficiently on organic nitrogen and possesses more nitrilase, asparaginase, and urease genes than other phytoplankton. (C) Interspecies comparison of the genes encoding proteins that contain the metals Se, Cu, Mo, Ni, and Co (left axis) and Semax, the selenium level (added as selenite shown as log concentrations) required to achieve maximal growth rates in A. anophagefferens, P. tricornutum, T. pseudonana, and Synechococcus (white circles; right axis). The range of dissolved selenium concentrations found in estuaries is depicted as a yellow bar on the right y axis. A. anophagefferens has the largest number of proteins containing Se, Cu, Mo, and Ni and blooms exclusively in shallow estuaries where inventories of these metals are high. SI Appendix contains details of irradiance- and Se-dependent growth data and Se concentrations in estuaries.
Fig. 3.
Fig. 3.
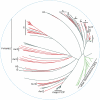
Phylogenetic tree constructed from amino acid sequences of predicted LHC proteins from two diatoms (P. tricornutum and T. pseudonana; black branches), two Ostreococcus species (O. tauri and O. lucimarinus; green branches), and A. anophagefferens (red branches). The tree constructed in MEGA4 (SI Appendix, Fig. S1) is displayed here after manipulation of the original branch lengths in Hypertree (http://kinase.com/tools/HyperTree.html) to aid visualization of major features of the tree. None of the Aureococcus LHCs were closely related to green plastid lineage LHCs, although four belonged to a group found in both the green and red plastid lineages (group I). None of the Aureococcus LHCs clustered with the major fucoxanthin-chlorophyll binding proteins (FCP) of diatoms and other heterokonts (major FCP group). However, many Aureococcus LHCs did group with similar sequences from P. tricornutum and T. pseudonana (as well as LHCs from other red-lineage algae not included in this tree; groups A–K). There were also five groups of A. anophagefferens LHCs that were not closely related to any other LHCs (Aur1 to Aur5). Group G includes 16 LHCs from A. anophagefferens and 2 LHCs from T. pseudonana, and it shares a unique PHYMKG motif near the end of helix two, with 10 additional A. anophagefferens LHCs plus 5 more from the diatoms. Cyanobacteria such as Synechococcus do not possess LHC proteins.
Fig. 4.
Fig. 4.
Genes encoding for enzymes involved in degrading organic carbon compounds in A. anophagefferens. The graph displays the portion and names of the genes encoding for functions that are unique to A. anophagefferens (red; 53%), enriched in A. anophagefferens relative to the six comparative phytoplankton (34%; green), and present at equal or lower numbers in A. anophagefferens relative to the six comparative phytoplankton (13%; blue). The number of genes present in multiple copies in A. anophagefferens is shown in parentheses. Further details regarding these genes are presented in SI Appendix, Tables S10 and S11.

References

    1. Heisler J, et al. Eutrophication and harmful algal blooms: A scientific consensus. Harmful Algae. 2008;8:3–13. - PMC - PubMed
    1. Sunda WG, Graneli E, Gobler CJ. Positive feedback and the development and persistence of ecosystem disruptive algal blooms. J Phycol. 2006;42:963–974.
    1. Anderson DM, et al. Harmful algal blooms and eutrophication: Examining linkages from selected coastal regions of the United States. Harmful Algae. 2008;8:39–53. - PMC - PubMed
    1. Smayda TJ. Harmful algal blooms: Their ecophysiology and general relevance to phytoplankton blooms in the sea. Limnol Oceanogr. 1997;42:1137–1153.
    1. Hoagland P, Scatasta S. In: Ecology of Harmful Algae. Graneli E, Turner J, editors. Berlin: Springer; 2006. pp. 391–402.

Publication types