. 2011 Mar 15;108(11):4453-8.
doi: 10.1073/pnas.1101657108. Epub 2011 Mar 1.

Hedgehog-responsive candidate cell of origin for diffuse intrinsic pontine glioma

Affiliations

Hedgehog-responsive candidate cell of origin for diffuse intrinsic pontine glioma

Michelle Monje et al. Proc Natl Acad Sci U S A. .

Abstract

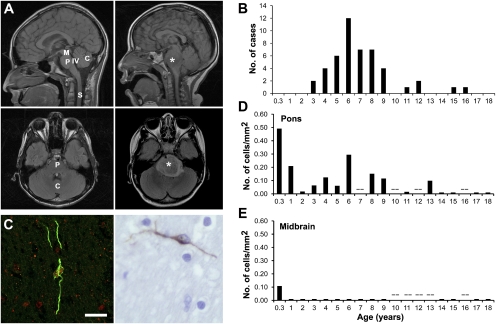
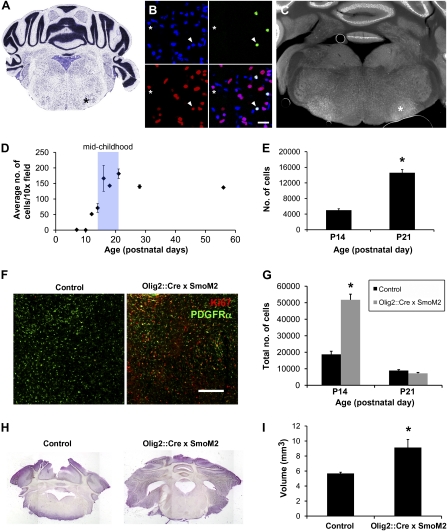
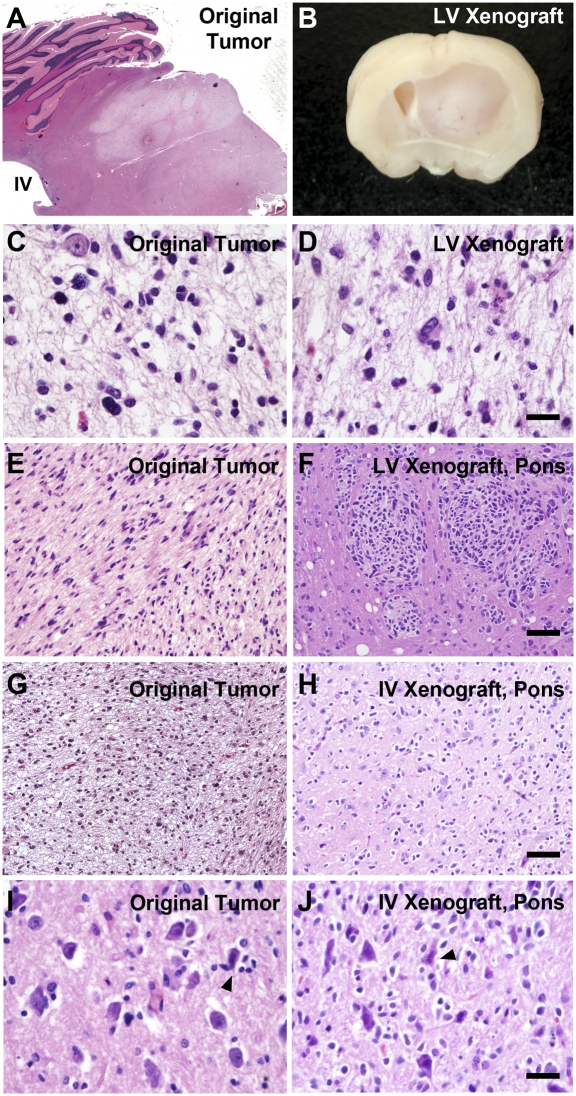
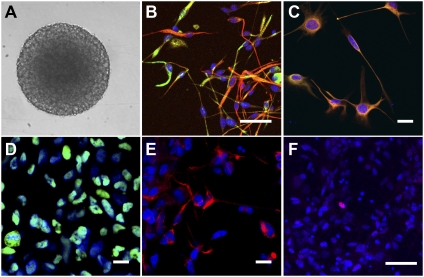
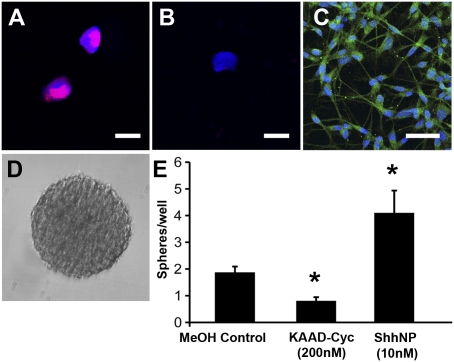
Diffuse intrinsic pontine gliomas (DIPGs) are highly aggressive tumors of childhood that are almost universally fatal. Our understanding of this devastating cancer is limited by a dearth of available tissue for study and by the lack of a faithful animal model. Intriguingly, DIPGs are restricted to the ventral pons and occur during a narrow window of middle childhood, suggesting dysregulation of a postnatal neurodevelopmental process. Here, we report the identification of a previously undescribed population of immunophenotypic neural precursor cells in the human and murine brainstem whose temporal and spatial distributions correlate closely with the incidence of DIPG and highlight a candidate cell of origin. Using early postmortem DIPG tumor tissue, we have established in vitro and xenograft models and find that the Hedgehog (Hh) signaling pathway implicated in many developmental and oncogenic processes is active in DIPG tumor cells. Modulation of Hh pathway activity has functional consequences for DIPG self-renewal capacity in neurosphere culture. The Hh pathway also appears to be active in normal ventral pontine precursor-like cells of the mouse, and unregulated pathway activity results in hypertrophy of the ventral pons. Together, these findings provide a foundation for understanding the cellular and molecular origins of DIPG, and suggest that the Hh pathway represents a potential therapeutic target in this devastating pediatric tumor.


Conflict of interest statement

The authors declare no conflict of interest.

Figures

Fig. 1.
Fig. 1.
Spatiotemporal distribution of ventral pontine PPCs and incidence of DIPG. (A) Sagittal and axial MRI scans showing normal brainstem anatomy (Left) and DIPG (Right). The DIPG tumor is indicated by an asterisk. C, cerebellum; M, midbrain, P, pons, S, spinal cord; IV, fourth ventricle. (B) Incidence of DIPG expressed at age of diagnosis. Data were drawn from the Stanford University Brain Tumor Database and represent all patients with DIPG cared for at Stanford University Medical Center from 1997–2008 (n = 47). (C) Ventral PPC visualized on confocal micrograph [Left; Nestin (green) and Olig2 (red), magnification 40×] and light micrograph [Right; Nestin (brown), magnification 60×]. (Scale bar: 50 μm.) Density of Nestin+ cells in the human ventral pons (D) and midbrain (E) as a function of postnatal age (n = 24). Each data point represents one to two cases; when two cases are represented, the value expressed is an average of the two. The symbol (--) denotes an age at which no valid tissue samples were available for analysis. Comparable data in the medulla are presented in Fig. S1E.
Fig. 2.
Fig. 2.
Hh pathway is sufficient to drive proliferation in the ventral pons during middle childhood. (AE) Hh-responsive Olig2+ cells in the murine pons. (A) Nissl stain of the mouse pons Allen Mouse Brain Atlas (Seattle, WA): Allen Institute for Brain Science. ©2009. Available at http://mouse.brain-map.org (36). Region of Hh-responsive Olig2+ precursor cells is marked with an asterisk. (B) Confocal photomicrograph (magnification 40×) illustrating colocalization of Olig2 (red) and β-galactosidase [indicating Gli1 expression (green)] in the Gli1::LacZ reporter mouse. DAPI expression (blue) is also shown. An arrowhead marks an example of an Olig2- and β-galactosidase–colabeled cell; an asterisk marks an example of a cell that is not colabeled. (C) Fluorescent micrograph (magnification 2.5×) showing Hh-responsive cells (white) in the Gli1::LacZ mouse. Note the cluster of Hh-responsive cells in the ventral pons (*). (D) Middle childhood peak in Hh-responsive cell density in the pons of the Gli1::LacZ transgenic reporter mouse. Data are expressed as the number of β-galactosidase–immunopositive cells per 10× field. Note the dramatic increase in Hh-responsive cells in the P14–P21 time frame, which represents the mouse equivalent of middle childhood. Data are mean ± SEM (n = 3 animals per time point). (E) Unbiased stereological quantification of the total number of Hh-responsive cells on one side of the ventral pons on P14 compared with P21. Data are mean ± SEM (n = 3 animals per time point; *P < 0.001). (F and G) Hh pathway activity increases proliferation in the ventral pons. (F) Confocal photomicrographs (magnification 10×) of Ki67+ cells (red) in control and Olig2::Cre × SmoM2 heterozygote mouse ventral pons at P14. PDGFR-α (green) is shown. (Scale bar: 20 μm.) (G) Unbiased stereological quantification of Ki67+ cells in the ventral pons at P14 in the Olig2::Cre × SmoM2 mouse pons vs. littermate controls. Data are mean ± SEM (n = 3 animals per group; *P < 0.005). (H and I) Hh pathway up-regulation results in ventral pontine hypertrophy. (H) Light micrographs (magnification 1.5×) of the ventral pons at P21 from Olig2::Cre × SmoM2 heterozygote and littermate control mice. Images shown represent a reconstruction of the entire coronal brain section from multiple images taken at 1.5× magnification. (I) Volume of the ventral pons at P21 in Olig2::Cre × SmoM2 heterozygotes vs. littermate controls. Data are expressed as the dorsal − ventral dimension × transverse dimension × rostrocaudal dimension in cubic millimeters. Data are mean ± SEM (n = 3 animals per group; *P < 0.05).
Fig. 3.
Fig. 3.
DIPG xenograft. H&E-stained light micrographs (A, CJ) and bright-field image of mouse brain (B). (Left) Original DIPG tumor. (A) Light micrograph (magnification 2×) of H&E-stained sagittal section through the pons of the tumor tissue donor. Diffuse infiltration of tumor in the ventral pons is visualized as lighter staining, notably sparing the dorsal region of pons that is closest to the IVth ventricle. The cerebellum is seen in the dorsolateral relationship to the pons in this plane of section. Additional images of the original tumor are shown at magnifications of 40× (C and I), 20× (E), and 10× (G). (Right) Mouse DIPG xenografts. (B) Following stereotactic transplantation of dissociated neurospheres from a human DIPG to the LV, examination of brains from immunodeficient mice reveals a large tumor and marked midline shift evident on a gross coronal section. (D) Diffuse infiltration by tumor is seen throughout the brain in H&E-stained sections (magnification 40×). (F) Although the DIPG cells were transplanted to the LVs, infiltration was seen in the hindbrain, including the pons (magnification 20×). (H and J) Transplantation of dissociated neurospheres from a human DIPG to the IVth ventricle resulted in diffuse infiltration of the pons. Note the perineuronal satellitosis (arrowheads) of tumor cells around pontine neurons (larger cells) seen in the xenograft (J) and original tumor (I). The histopathology of the mouse xenograft was indistinguishable from that of the original tumor. (Scale bars: C, D, and IJ, 50 μm; EH, 100 μm; G and H, 250 μm.)
Fig. 4.
Fig. 4.
DIPG neurosphere culture. (A) Tumor neurosphere is shown on a light micrograph (magnification 10×). Immunocytochemistry and confocal microscopy (magnification 40×) reveal DIPG tumor neurosphere cells that are uniformly immunopositive for GFAP (B, red), Nestin (B and C, green) Vimentin (C, red), and Sox2 (D, green). Immunocytochemistry for CD133 (E, red) reveals a CD133+ fraction of about one-third of cells. Rare cells are immunopositive for Olig2 (F, red). DAPI (blue) was used as a nuclear counterstain in images BF. (Scale bars: 50 μm.)
Fig. 5.
Fig. 5.
Hh pathway activity in DIPG. (A) DIPG tumor cells transduced with a lentiviral Hh pathway reporter construct, Gli1::RFP. A confocal photomicrograph (magnification 40×) illustrates RFP (red) and a DAPI nuclear counterstain (blue). (B) Confocal photomicrograph (magnification 40×) illustrates lack of RFP (red) signal in negative control tumor cells transduced with a mutated Gli1 binding site::RFP construct and a DAPI nuclear counterstain (blue). (Scale bar: 30 μm.) (C) Confocal photomicrograph (magnification 40×) demonstrates Shh ligand expression (green) in DIPG tumor neurosphere cells. A DAPI nuclear counterstain (blue) is also shown. (D) Light micrograph (magnification 10×) of a secondary tumor neurosphere at 14 d following dissociation and FACS sorting of live cells at low density (100 cells per well in a 96-well plate format). (E) Quantification of secondary tumor neurospheres (such as that seen in D) at 14 d following dissociation and FACS sorting of live cells at low density (100 cells per well) and exposed to either KAAD-cyclopamine (200 nM), ShhNp (10 nM), or methanol vehicle control. Data are expressed as the average number of tumor neurospheres per well ± SEM (n = 10–16 wells per condition; *P < 0.05).

References

    1. Central Brain Tumor Registry of the United States . CBTRUS Statistical Report: Primary Brain and Central Nervous System Tumors Diagnosed in the United States in 2004-2006. Hinsdale, IL: Central Brain Tumor Registry of the United States; 2010.
    1. Barkovich AJ, et al. Brain stem gliomas: A classification system based on magnetic resonance imaging. Pediatr Neurosurg. 1990-1991;16:73–83. - PubMed
    1. Fisher PG, et al. A clinicopathologic reappraisal of brain stem tumor classification. Identification of pilocystic astrocytoma and fibrillary astrocytoma as distinct entities. Cancer. 2000;89:1569–1576. - PubMed
    1. Donaldson SS, Laningham F, Fisher PG. Advances toward an understanding of brainstem gliomas. J Clin Oncol. 2006;24:1266–1272. - PubMed
    1. Zhao C, Deng W, Gage FH. Mechanisms and functional implications of adult neurogenesis. Cell. 2008;132:645–660. - PubMed

Publication types

MeSH terms

LinkOut - more resources