. 2011 Apr 1;186(7):3918-26.
doi: 10.4049/jimmunol.1003099. Epub 2011 Mar 2.

Plasticity of human regulatory T cells in healthy subjects and patients with type 1 diabetes

Affiliations

Plasticity of human regulatory T cells in healthy subjects and patients with type 1 diabetes

Stephanie A McClymont et al. J Immunol. .

Abstract

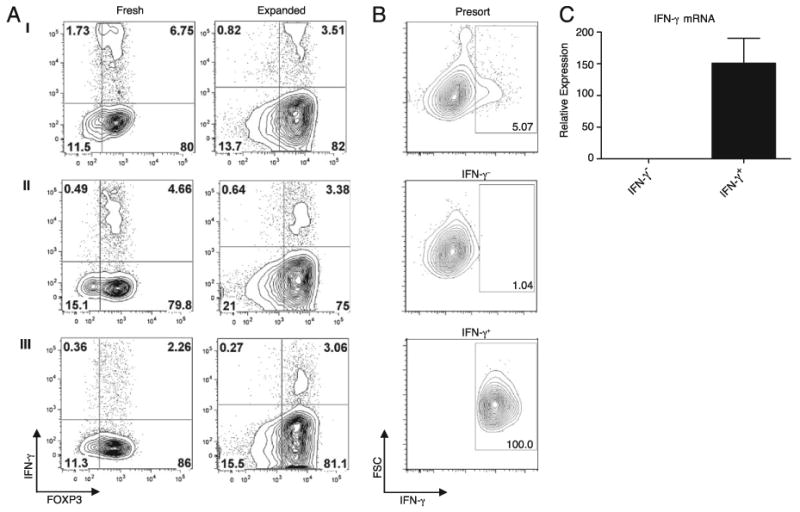
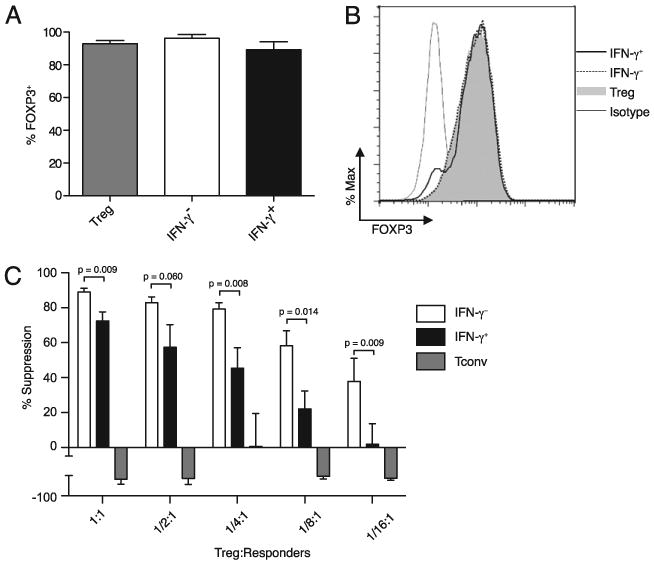
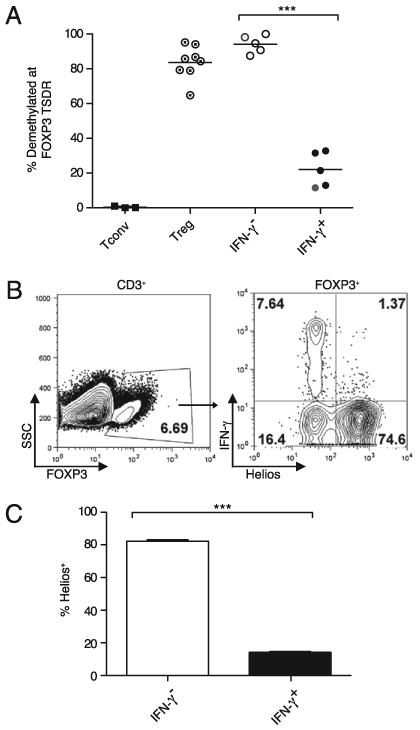
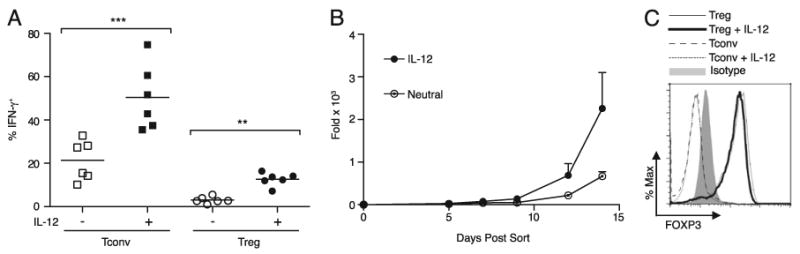
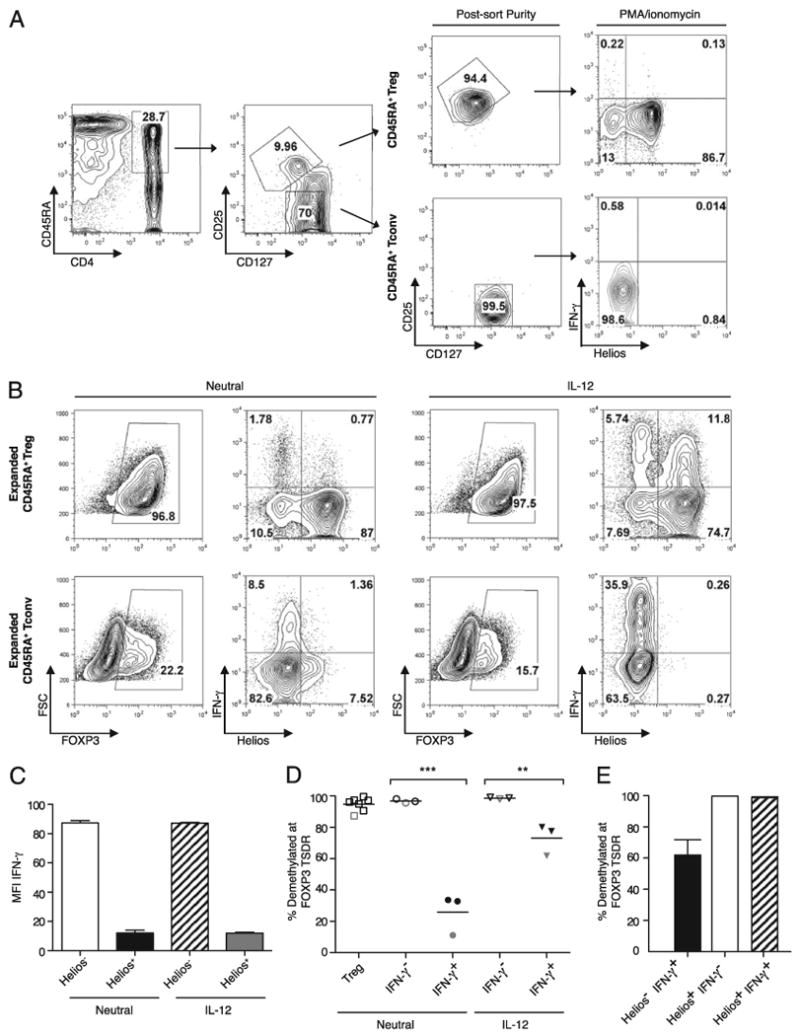
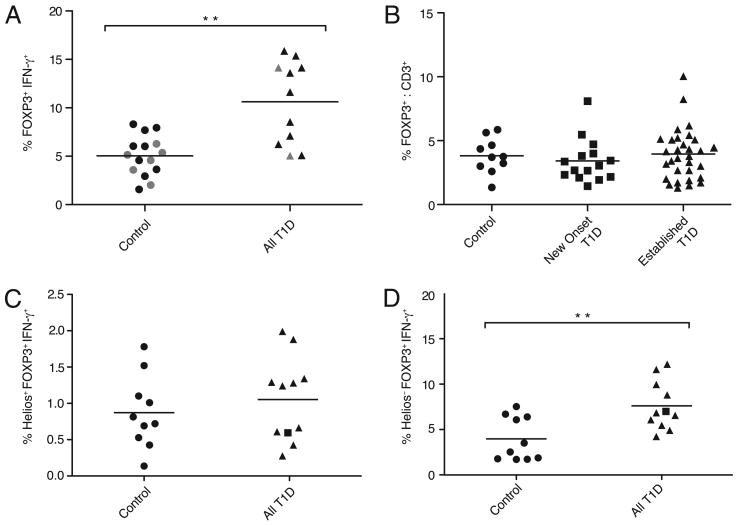
Regulatory T cells (Tregs) constitute an attractive therapeutic target given their essential role in controlling autoimmunity. However, recent animal studies provide evidence for functional heterogeneity and lineage plasticity within the Treg compartment. To understand better the plasticity of human Tregs in the context of type 1 diabetes, we characterized an IFN-γ-competent subset of human CD4(+)CD127(lo/-)CD25(+) Tregs. We measured the frequency of Tregs in the peripheral blood of patients with type 1 diabetes by epigenetic analysis of the Treg-specific demethylated region (TSDR) and the frequency of the IFN-γ(+) subset by flow cytometry. Purified IFN-γ(+) Tregs were assessed for suppressive function, degree of TSDR demethylation, and expression of Treg lineage markers FOXP3 and Helios. The frequency of Tregs in peripheral blood was comparable but the FOXP3(+)IFN-γ(+) fraction was significantly increased in patients with type 1 diabetes compared to healthy controls. Purified IFN-γ(+) Tregs expressed FOXP3 and possessed suppressive activity but lacked Helios expression and were predominately methylated at the TSDR, characteristics of an adaptive Treg. Naive Tregs were capable of upregulating expression of Th1-associated T-bet, CXCR3, and IFN-γ in response to IL-12. Notably, naive, thymic-derived natural Tregs also demonstrated the capacity for Th1 differentiation without concomitant loss of Helios expression or TSDR demethylation.


Figures

FIGURE 1
FIGURE 1
Isolation of viable in vitro-expanded Tregs capable of producing IFN-γ. A, Flow cytometric analysis of intracellular IFN-γ and FOXP3 expression in CD4+CD127lo/−CD25+ Tregs purified from three individuals (rows I, II, and III) are shown. Cytokine expression was assessed in an aliquot removed immediately after the initial Treg sort (left panels) and after a 14-d expansion period (right panels). B, After expansion, CD4+CD127lo/−CD25+ Tregs were labeled with IFN-γ capture reagent. Frequencies of IFN-γ+ cells before (top plot) and after cytokine capture and sorting of IFN-γ (center plot) and IFN-γ+ (bottom plot) cells. Data are representative of four experiments. C, Real-time quantitative PCR analysis of IFN-γ expression after cytokine capture and sorting of IFN-γ–producing cells. Mean ± SD of two independent experiments with triplicate measurements, indexed to IFN-γ Teff cells, is shown.
FIGURE 2
FIGURE 2
The IFN-γ+ subset expresses FOXP3 protein and has suppressive function. A, Percentage of expanded, PMA/ionomycin-stimulated cells expressing FOXP3 in bulk expanded (grey bar) (n = 8), IFN-γ (white bar), and IFN-γ+ (black bar) sorted (n = 3) Tregs, assessed by FACS. Shown are the mean ± SD. p = not significant (ANOVA). B, Representative histogram showing FOXP3 expression in bulk expanded CD4+CD127lo/−CD25+ Tregs (shaded) and IFN-γ (dashed line) and IFN-γ+ (solid line) sorted Tregs. C, Percentage suppression of Tresp cell proliferation in response to CD3 and CD28 stimulation in vitro, as determined by [3H] thymidine incorporation. Bulk Tconv cells (n = 6, gray bars) and sorted IFN-γ (white bars) and IFN-γ+ (black bars) Tregs (n = 7) were assayed for suppressive function. Shown are mean + SEM. The p values for the percentage suppression by IFN-γ+ compared with IFN-γ Tregs are shown (two-tailed paired t test).
FIGURE 3
FIGURE 3
IFN-γ+ Tregs lack characteristic markers of nTregs. A, Percentage of expanded CD4+CD127+CD25 Tconv cells (squares) and CD4+CD127lo/−CD25+ Tregs (circles) demethylated at the FOXP3 TSDR. IFN-γ and IFN-γ+ Treg subsets were sorted by cytokine capture (black) or by fixation and intracellular FOXP3 and IFN-γ staining (gray). ***p < 0.001 (ANOVA). B and C, CD4+ PBMCs were enriched with RosetteSep and stimulated 4 h with PMA/ionomycin. B, Representative flow cytometric analysis of intracellular IFN-γ and Helios expression in the CD3+ FOXP3+ gated population. C, Percentage of Helios+ cells within the IFN-γ− and IFN-γ+ subsets of the CD3+FOXP3+ population. The mean ± SD of three independent experiments is shown. ***p = 0.0003 (two-tailed paired t test).
FIGURE 4
FIGURE 4
Naive Tregs can be skewed to produce IFN-γ under Th1-polarizing conditions. A, Naive CD4+CD127lo/−CD25+CD45RA+CD45RO Tregs and CD4+CD127+CD25CD45RA+CD45RO Tconv cells were expanded in neutral conditions (open symbols) or with IL-12 added at initial activation (solid symbols). Percentage of Tconv cells or FOXP3+ Tregs expressing IFN-γ+ at day 14 was determined by intracellular staining and flow cytometry after a 4-h PMA/ionomycin stimulation. **p < 0.01, ***p < 0.001 (two-tailed paired t tests). B, Fold expansion of naive Tregs (n = 6) with (solid circles) or without (open circles) IL-12 added at initial activation. p = not significant (two-tailed paired t tests). C, Overlaid histogram showing FOXP3 expression in Treg cultures with (heavy line) or without (light line) IL-12. p = not significant. FOXP3 expression in Tconv cell cultures was also comparable with (dotted) or without (dashed line) IL-12.
FIGURE 5
FIGURE 5
Naive nTregs express IFN-γ in response to IL-12 but maintain Helios expression and TSDR demethylation. A, Immediately after sorting, naive CD4+CD127lo/−CD25+CD45RA+ Tregs and CD4+CD127+CD25CD45RA+ Tconv cells were stimulated with PMA/ionomycin for 4 h and assessed for intracellular IFN-γ and Helios expression. B, Naive Tregs and Tconv cells were cultured 14 d in neutral (n = 2) or Th1 conditions (with IL-12; n = 4) as indicated. Representative flow cytometric analysis of intracellular FOXP3, Helios, and IFN-γ in naive Tregs and naive Tconv cells after 4-h PMA/ionomycin stimulation. C, IFN-γ MFI in Helios (white and striped bars) and Helios+ (black and gray bars) naive Treg subsets gated on FOXP3+IFN-γ+ cells after expansion with or without IL-12 as indicated (n = 2). D, Purified naive CD4+CD127lo/−CD25+CD45RA+CD45RO Tregs (squares) were cultured 14 d in neutral conditions or with IL-12 added at initial activation, as indicated, and then assessed for TSDR demethylation. IFN-γ and IFN-γ+ Treg subsets were sorted from neutral and skewed cultures by cytokine capture (black) or by fixation and intracellular FOXP3 and IFN-γ staining (gray). **p < 0.01, ***p < 0.001 (ANOVA). E, Purified naive CD4+CD127lo/−CD25+CD45RA+ Tregs were expanded 14 d with IL-12 added at initial activation. PMA/ionomycin-stimulated, fixed cells were sorted based on intracellular IFN-γ, FOXP3, and Helios expression, and the percentage TSDR demethylation in each subset was quantified. Mean + SD is shown (n = 2).
FIGURE 6
FIGURE 6
Patients with type 1 diabetes have an increased IFN-γ+ Treg fraction. A, Percentage of FOXP3+IFN-γ+ cells after 14-d in vitro expansion of CD4+CD127lo/−CD25+ Tregs from controls (n = 15) or patients with type 1 diabetes (n = 11, including 2 established [gray] and 9 recent-onset [black] cases). Intracellular staining was performed after 4-h PMA/ionomycin stimulation and assessed by flow cytometry. When repeated longitudinal measures were taken (gray), the median is shown. **p < 0.01 (Mann–Whitney U test). B, PBMCs from healthy controls (n = 11) or patients with recent-onset (n = 12) or established (n = 28) type 1 diabetes were assessed by real-time quantitative PCR for methylation at the FOXP3 TSDR and CD3 loci. Percentage of FOXP3+ cells normalized to total CD3+ cells is shown. p = not significant (Mann–Whitney U test). C and D, Unexpanded PBMCs from healthy controls (n = 10) or patients with type 1 diabetes (n = 11, including 1 recent-onset case [square]) were stimulated 4 h with PMA/ionomycin. For FACS analysis, viable CD4+ lymphocytes were gated, and FOXP3, Helios, and IFN-γ gates were set as shown in Fig. 3B. C, Percentage of Helios+FOXP3+IFN-γ+ cells. p = not significant. D, Percentage of HeliosFOXP3+IFN-γ+ cells. **p < 0.01 (unpaired t tests).

Similar articles

Cited by

References

    1. Bach JF. Autoimmune diseases as the loss of active “self-control”. Ann NY Acad Sci. 2003;998:161–177. - PubMed
    1. Atkinson MA, Eisenbarth GS. Type 1 diabetes: new perspectives on disease pathogenesis and treatment. Lancet. 2001;358:221–229. - PubMed
    1. Brusko TM, Putnam AL, Bluestone JA. Human regulatory T cells: role in autoimmune disease and therapeutic opportunities. Immunol Rev. 2008;223:371–390. - PubMed
    1. Bluestone JA, Tang Q. Therapeutic vaccination using CD4+CD25+ antigen-specific regulatory T cells. Proc Natl Acad Sci USA. 2004;101(Suppl 2):14622–14626. - PMC - PubMed
    1. Liu W, Putnam AL, Xu-Yu Z, Szot GL, Lee MR, Zhu S, Gottlieb PA, Kapranov P, Gingeras TR, Fazekas de St Groth B, et al. CD127 expression inversely correlates with FoxP3 and suppressive function of human CD4+ T reg cells. J Exp Med. 2006;203:1701–1711. - PMC - PubMed

Publication types

MeSH terms