. 2011 Jun;300(6):C1502-12.
doi: 10.1152/ajpcell.00379.2010. Epub 2011 Mar 2.

Dysregulation of Ca2+ signaling in astrocytes from mice lacking amyloid precursor protein

Affiliations

Dysregulation of Ca2+ signaling in astrocytes from mice lacking amyloid precursor protein

Cristina I Linde et al. Am J Physiol Cell Physiol. 2011 Jun.

Abstract

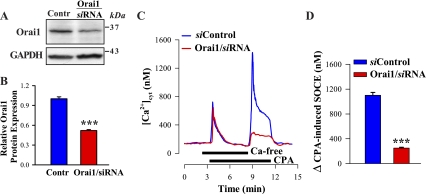
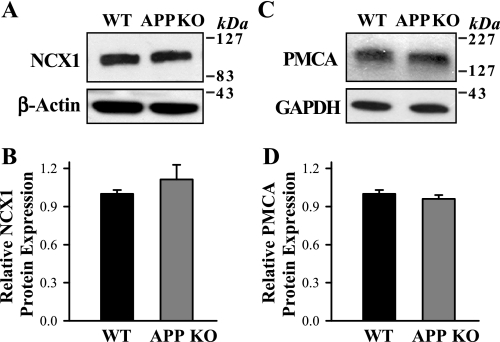
The relationship between altered metabolism of the amyloid-β precursor protein (APP) and Alzheimer's disease is well established but the physiological roles of APP still remain unclear. Here, we studied Ca(2+) signaling in primary cultured and freshly dissociated cortical astrocytes from APP knockout (KO) mice and from Tg5469 mice overproducing by five- to sixfold wild-type APP. Resting cytosolic Ca(2+) (measured with fura-2) was not altered in cultured astrocytes from APP KO mice. The stored Ca(2+) evaluated by measuring peak amplitude of cyclopiazonic acid [CPA, endoplasmic reticulum (ER) Ca(2+) ATPase inhibitor]-induced Ca(2+) transients in Ca(2+)-free medium was significantly smaller in APP KO astrocytes than in wild-type cells. Store-operated Ca(2+) entry (SOCE) activated by ER Ca(2+) store depletion with CPA was also greatly reduced in APP KO astrocytes. This reflected a downregulated expression in APP KO astrocytes of TRPC1 (C-type transient receptor potential) and Orai1 proteins, essential components of store-operated channels (SOCs). Indeed, silencer RNA (siRNA) knockdown of Orai1 protein expression in wild-type astrocytes significantly attenuated SOCE. SOCE was also essentially reduced in freshly dissociated APP KO astrocytes. Importantly, knockdown of APP with siRNA in cultured wild-type astrocytes markedly attenuated ATP- and CPA-induced ER Ca(2+) release and extracellular Ca(2+) influx. The latter correlated with downregulation of TRPC1. Overproduction of APP in Tg5469 mice did not alter, however, the stored Ca(2+) level, SOCE, and expression of TRPC1/4/5 in cultured astrocytes from these mice. The data demonstrate that the functional role of APP in astrocytes involves the regulation of TRPC1/Orai1-encoded SOCs critical for Ca(2+) signaling.


Figures

Fig. 1.
Fig. 1.
Altered Ca2+ homeostasis in primary cultured astrocytes from amyloid-β precursor protein (APP) knockout (KO) mice. A: Western blot showing the absence of APP expression in astrocytes from APP KO mice. Membrane proteins (20 μg/lane) from wild-type (WT) and APP KO astrocytes were loaded and probed with specific anti-APP antibodies. Blots were later incubated with anti-GAPDH antibodies to verify uniform protein loading. Representative Western blot is shown; comparable results were obtained in 6 immunoblots. B: summarized data showing resting cytosolic free Ca2+ concentration ([Ca2+]cyt) in WT and APP KO astrocytes. Data are means ± SE (n = 160 WT astrocytes and n = 150 APP KO cells, 35 coverslips). C and D: representative records showing the time course of [Ca2+]cyt changes in control WT (C) and APP KO astrocytes (D). Cyclopiazonic acid (CPA; 10 μM) was applied to the cells in the absence and presence of extracellular Ca2+, as indicated. Nifedipine (10 μM) was applied 10 min before the traces shown and was maintained throughout the experiment. E and F: summarized data showing the CPA-induced transient Ca2+ peak in the absence of extracellular Ca2+ (E) and the amplitude of store-operated Ca2+ entry (SOCE) (F) in WT and APP KO astrocytes. The data are shown as quantitative differences of CPA-induced transient Ca2+ peaks relative to the baseline [Ca2+]cyt levels (before any treatment). Data are means ± SE (n = 160 WT astrocytes and n = 150 APP KO astrocytes, 36 coverslips). Each bar corresponds to data from a total 12 fetuses from 12 litters. **P < 0.05 and ***P < 0.001 vs. control WT cells.
Fig. 2.
Fig. 2.
Expression of C-type transient receptor potential channels (TRPCs), STIM1, and Orai1 in primary cultured WT and APP KO astrocytes. AL: Western blot analysis of TRPC1 (A and B), TRPC4 (C and D), TRPC5 (E and F), TRPC3 (G and H), STIM1 (I and J), and Orai1 (K and L) protein expression in astrocyte membranes from WT and APP KO mice. Representative blots are shown in A, C, E, G, I, and K. Membrane proteins (20 μg/lane in A, C, E, G, and I; 50 μg/lane in K) were loaded and probed with specific antibodies. Summary data (B, D, F, H, J, and L) were normalized to the amount of β-actin or GAPDH and are expressed as means ± SE from 7 (B), 7 (D), 4 (F), 5 (H), 4 (J), and 4 (L) immunoblots (14 litters). **P < 0.05 vs. WT astrocytes.
Fig. 3.
Fig. 3.
Knockdown of the Orai1 gene markedly reduces SOCE in cultured wild-type mouse cortical astrocytes. A: Western blot showing knockdown of endogenous Orai1 protein in cultured astrocytes treated with Orai1 small interfering (si)RNA. Contr, cells treated with nontargeting siRNA. Membrane proteins (50 μg/lane) were loaded and probed with specific anti-Orai1 antibodies. Blots were later incubated with anti-GAPDH antibodies to verify uniform protein loading. B: data were normalized to the amount of GAPDH and are expressed as means ± SE from 5 Western blots. ***P < 0.001 vs. Orai1 protein expression in control cells. C: representative records showing the time course of [Ca2+]cyt changes in control astrocytes (siControl, blue) and cells treated with Orai1/siRNA (red). CPA (10 μM) was applied to the cells in the absence and presence of extracellular Ca2+, as indicated. Nifedipine (10 μM) was applied 10 min before the traces shown and was maintained throughout the experiment. D: summarized data showing the amplitude of CPA-induced SOCE in control astrocytes (blue bar) and cells treated with Orai1/siRNA (red bar). The data are shown as quantitative differences of CPA-induced transient Ca2+ peaks relative to the baseline [Ca2+]cyt levels (before restoration of extracellular Ca2+). Data are means ± SE (n = 49 cells transfected with nontargeting siRNA and n = 52 cells transfected with Orai1/siRNA, 21 coverslips). ***P < 0.001 vs. control.
Fig. 4.
Fig. 4.
Expression of Na+/Ca2+ exchanger 1 (NCX1) and plasma membrane Ca2+ pump (PMCA) in primary cultured WT and APP KO astrocytes. A–D: Western blot analysis of NCX1 (A and B) and PMCA (C and D) protein expression in astrocyte membranes from WT and APP KO mice. Representative blots are shown in A and C. Membrane proteins (20 μg/lane) were loaded and probed with specific antibodies. Summary data (B and D) were normalized to the amount of β-actin (B) and GAPDH (D) and are expressed as means ± SE from 4 (B) and 4 (D) immunoblots (4 litters).
Fig. 5.
Fig. 5.
Reduced Ca2+ entry through store-operated channels in freshly dissociated astrocytes from APP KO mice. A and B: CPA-evoked Ca2+ transients (“Ca2+ release”) and subsequent SOCE in freshly dissociated astrocytes from WT and APP KO mice. Representative original [Ca2+]cyt data are shown. CPA (10 μM) was applied in Ca2+-free (where indicated) and Ca2+-containing solutions. Nifedipine (10 μM) was added 10 min before the recordings shown and was maintained throughout the experiment. CE: summarized data showing the resting [Ca2+]cyt (C), the CPA-induced transient Ca2+ peak in the absence of extracellular Ca2+ (D), and the secondary rise in [Ca2+]cyt when Ca2+ was added back (SOCE) (E). The data in D and E are shown as quantitative differences of CPA-induced transient Ca2+ peaks relative to the baseline [Ca2+]cyt levels (before any treatment). Data are means ± SE (n = 119 WT astrocytes and n = 172 APP KO astrocytes; 4 fetuses from 4 litters). **P < 0.05 vs. WT astrocytes.
Fig. 6.
Fig. 6.
Knockdown of the APP expression in vitro markedly reduces CPA-evoked SOCE in cultured wild-type mouse cortical astrocytes. A: Western blot showing knockdown of endogenous APP in astrocytes treated with APP siRNA. Contr, cells treated with nontargeting siRNA. Membrane proteins (30 μg/lane) were loaded and probed with specific anti-APP antibodies. Blots were later incubated with anti-β-actin antibodies to verify uniform protein loading. B: data were normalized to the amount of β-actin and are expressed as means ± SE from 7 Western blots. ***P < 0.001 vs. APP expression in control cells. C: representative records showing the time course of [Ca2+]cyt changes in control astrocytes (siControl, blue) and cell treated with APP/siRNA (red). CPA (10 μM) was applied to the cells in the absence and presence of extracellular Ca2+, as indicated. Nifedipine (10 μM) was applied 10 min before the traces shown and was maintained throughout the experiment. D: summarized data showing the CPA-induced transient Ca2+ peak in the absence of extracellular Ca2+ and the amplitude of SOCE in control astrocytes (blue bars) and cells treated with APP/siRNA (red bars). The data are shown as quantitative differences of CPA-induced transient Ca2+ peaks relative to the baseline [Ca2+]cyt levels (before any treatment). Data are means ± SE (n = 82 cells transfected with nontargeting siRNA and n = 93 cells transfected with APP/siRNA, 34 coverslips). **P < 0.05 and ***P < 0.001 vs. control. E, G, and I: Western blot analysis of TRPC1 (E; 30 μg/lane), TRPC4 (G; 30 μg/lane), and TRPC5 (I; 30 μg/lane) protein expression in control astrocytes and cells treated with APP/siRNA. F, H, and J: data were normalized to the amount of β-actin and are expressed as means ± SE from 5 (F), 4 (H), and 4 (J) Western blots. ***P < 0.001 vs. TRPC1 expression in control astrocytes.
Fig. 7.
Fig. 7.
Knockdown of the APP expression in vitro reduces ATP-induced Ca2+ release and Ca2+ influx in cultured wild-type mouse cortical astrocytes. A: representative records showing the time course of [Ca2+]cyt changes in control astrocytes (siControl, blue) and cell treated with APP/siRNA (red). ATP (5 μM) was applied to the cells in the absence and presence of extracellular Ca2+, as indicated. Nifedipine (10 μM) was added 10 min before the records shown and was maintained throughout the experiment. B: summarized data showing the ATP-induced Ca2+ release and Ca2+ influx in control astrocytes (blue bars) and cells treated with APP/siRNA (red bars). The data are shown as quantitative differences of ATP-induced transient Ca2+ peaks relative to the baseline [Ca2+]cyt levels (before any treatment). Data are means ± SE (n = 36 cells transfected with nontargeting siRNA and n = 43 cells transfected with APP/siRNA, 16 coverslips). **P < 0.05 and ***P < 0.001 vs. control.
Fig. 8.
Fig. 8.
Overproduction of APP does not affect Ca2+ homeostasis in primary cultured cortical astrocytes from Tg5469 mice. A: Western blot showing overexpression of endogenous APP in astrocytes from Tg5469 mice compared with control (non-Tg) astrocytes. Membrane proteins (20 μg/lane) were loaded and probed with specific anti-APP antibodies. B: data were normalized to the amount of β-actin and are expressed as means ± SE from 4 Western blots. ***P < 0.001 vs. APP expression in non-Tg astrocytes. C: representative records showing the time course of [Ca2+]cyt changes in control astrocytes (non-Tg, black) and Tg5469 astrocytes (gray). CPA (10 μM) was applied to the cells in the absence and presence of extracellular Ca2+, as indicated. Nifedipine (10 μM) was applied 10 min before the traces shown and was maintained throughout the experiment. D: summarized data showing the CPA-induced transient Ca2+ peak in the absence of extracellular Ca2+ and the amplitude of SOCE in control astrocytes (black bars; n = 65 cells) and Tg5469 cells (gray bars; 97 cells). The data are shown as quantitative differences of CPA-induced transient Ca2+ peaks relative to the baseline [Ca2+]cyt levels (before any treatment). Data are means ± SE (n = 21 coverslips). EJ: Western blot analysis of TRPC1 (E and F), TRPC4 (G and H), and TRPC5 (I and J) protein expression in astrocyte membranes from control non-Tg and Tg5469 mice. Representative blots are shown in E, G, and I. All lanes were loaded with 20 μg of membrane protein. Summary data (F, H, and J) were normalized to the amount of β-actin (F and H) or GAPDH (J) and are expressed as means ± SE from 6 (F), 4 (H), and 4 (J) immunoblots. Each bar corresponds to data from a total 11 fetuses from 11 litters.

Similar articles

Cited by

References

    1. Abramov AY, Canevari L, Duchen MR. Changes in intracellular calcium and glutathione in astrocytes as the primary mechanism of amyloid neurotoxicity. J Neurosci 23: 5088–5095, 2003 - PMC - PubMed
    1. Aguado F, Espinosa-Parrilla JF, Carmona MA, Soriano E. Neuronal activity regulates correlated network properties of spontaneous calcium transients in astrocytes in situ. J Neurosci 22: 9430–9444, 2002 - PMC - PubMed
    1. Akaike N, Kostyuk PG, Osipchuk YV. Dihydropyridine-sensitive low-threshold calcium channels in isolated rat hypothalamic neurones. J Physiol 412: 181–195, 1989 - PMC - PubMed
    1. Araque A, Sanzgiri RP, Parpura V, Haydon PG. Astrocyte-induced modulation of synaptic transmission. Can J Physiol Pharmacol 77: 699–706, 1999 - PubMed
    1. Bambrick LL, de Grip A, Seenivasan V, Krueger BK, Yarowsky PJ. Expression of glial antigens in mouse astrocytes: species differences and regulation in vitro. J Neurosci Res 46: 305–315, 1996 - PubMed

Publication types

MeSH terms

LinkOut - more resources