In vitro toxicity of melamine against Tetrahymena pyriformis cells
- PMID: 21368560
- PMCID: PMC3053464
- DOI: 10.4142/jvs.2011.12.1.27
In vitro toxicity of melamine against Tetrahymena pyriformis cells
Abstract
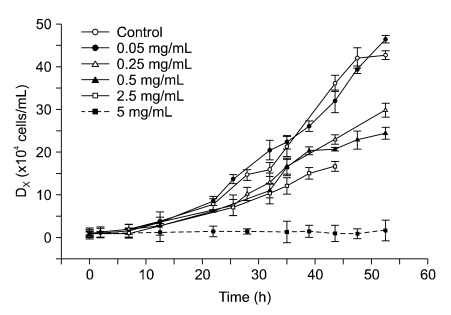
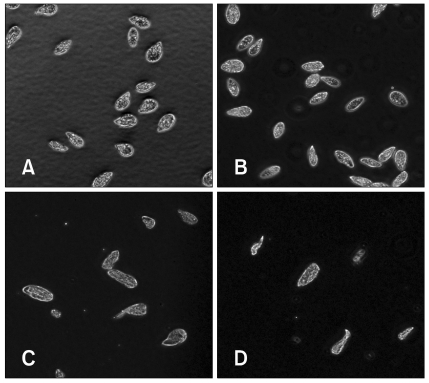
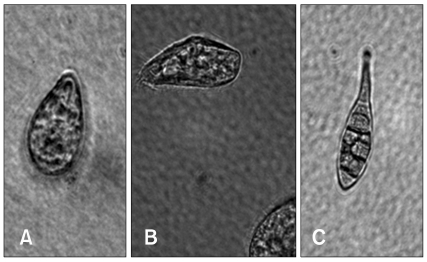
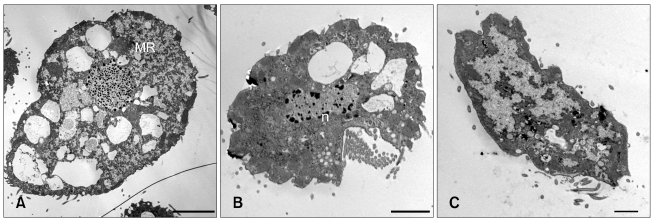
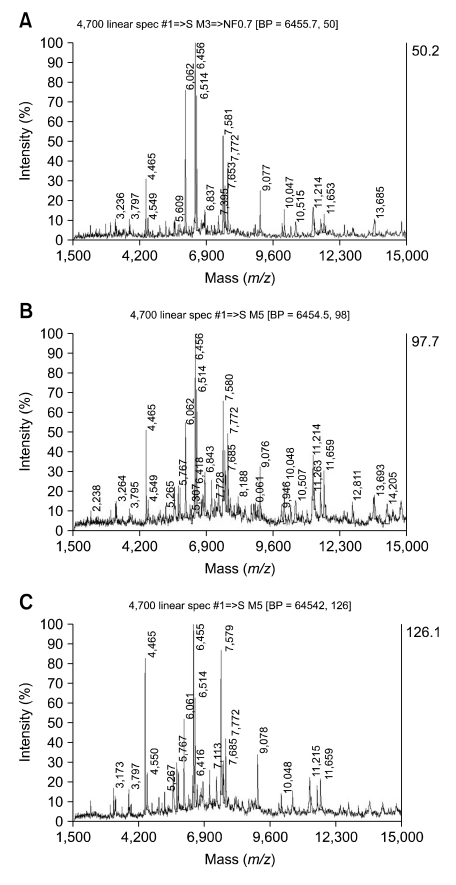
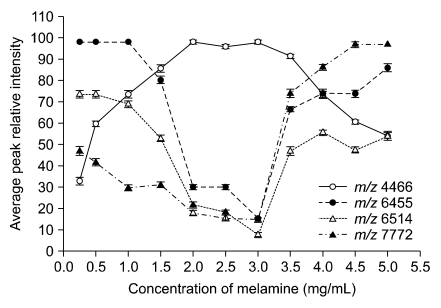
This study assessed the toxicity of melamine against the unicellular eukaryotic system of Tetrahymena (T.) pyriformis exposed to 0, 0.05, 0.25, 0.5, 2.5, and 5 mg/mL of melamine. Cell growth curves of different cultures, the half maximum inhibition concentration (IC(50)) value of melamine, and morphological changes in cells were obtained via optical and transmission electron microscopic observation. The effects of eleven melamine concentrations, 0.25, 0.5, 1, 1.5, 2, 2.5, 3, 3.5, 4, 4.5 and 5 mg/mL, on protein expression levels of T. pyriformis were examined using matrix-assisted laser desorption/ionization time-of-flight mass spectrometry (MALDI-TOF-MS). The results showed an obvious inhibitory effect of melamine on the growth of eukaryotic cells. Cell growth dynamics indicated that the IC(50) value of melamine on T. pyriformis was 0.82 mg/mL. The cellular morphology was also affected in a concentration-dependent manner, with characteristics of atrophy or cell damage developing in the presence of melamine. The relative contents of the top four main proteins corresponding to peak mass-to-charge ratios (m/z) of 4466, m/z 6455, m/z 6514, and m/z 7772 in the MALDI-TOF-MS spectra were all found to be closely correlated with the melamine concentrations. In conclusion, exposure of eukaryotic cells to melamine could inhibit cell growth, cause changes in cytomorphology and even disturb the expression of proteins in a concentration-dependent manner. The described method of examining four sensitive proteins affected by melamine was also proposed to be used in a preliminary study to identify protein biomarkers in T. pyriformis.
Figures
Similar articles
-
Detection of melamine in a human renal uric acid stone by matrix-assisted laser desorption/ionization time-of-flight mass spectrometry (MALDI-TOF MS).Clin Chim Acta. 2012 Oct 9;413(19-20):1689-95. doi: 10.1016/j.cca.2012.04.016. Epub 2012 Apr 21. Clin Chim Acta. 2012. PMID: 22548855
-
Determination of spatial distribution of melamine-cyanuric acid crystals in rat kidney tissue by histology and imaging matrix-assisted laser desorption/ionization quadrupole time-of-flight mass spectrometry.Chem Res Toxicol. 2010 Jan;23(1):220-7. doi: 10.1021/tx900354z. Chem Res Toxicol. 2010. PMID: 19961162
-
Peptidome profiles in melamine diet-induced bladder stones in C57BL/6 mice.Toxicol Appl Pharmacol. 2019 Dec 15;385:114786. doi: 10.1016/j.taap.2019.114786. Epub 2019 Oct 23. Toxicol Appl Pharmacol. 2019. PMID: 31655076
-
Increased detection rate of melamine-containing calcium urolithiasis by using matrix-assisted laser desorption/ionization time-of-flight mass spectrometry technique in clinical practice.Clin Chim Acta. 2014 Apr 20;431:294-8. doi: 10.1016/j.cca.2014.01.010. Epub 2014 Feb 12. Clin Chim Acta. 2014. PMID: 24530299
-
Effect of melamine toxicity on Tetrahymena thermophila proliferation and metallothionein expression.Food Chem Toxicol. 2015 Jun;80:1-6. doi: 10.1016/j.fct.2015.01.015. Epub 2015 Feb 23. Food Chem Toxicol. 2015. PMID: 25720813
Cited by
-
Caged Polyprenylated Xanthones in Garcinia hanburyi and the Biological Activities of Them.Drug Des Devel Ther. 2023 Dec 5;17:3625-3660. doi: 10.2147/DDDT.S426685. eCollection 2023. Drug Des Devel Ther. 2023. PMID: 38076632 Free PMC article. Review.
References
-
- Al-Chalabi KAK, Al-Khayat BHA. The effect of lindane on nucleic acids, protein and carbohydrate content in Tetrahymena pyriformis. Environ Pollut. 1989;57:281–287. - PubMed
-
- Andersen WC, Turnipseed SB, Karbiwnyk CM, Clark SB, Madson MR, Gieseker CM, Miller RA, Rummel NG, Reimschuessel R. Determination and confirmation of melamine residues in catfish, trout, tilapia, salmon, and shrimp by liquid chromatography with tandem mass spectrometry. J Agric Food Chem. 2008;56:4340–4347. - PubMed
-
- Baynes RE, Smith G, Mason SE, Barrett E, Barlow BM, Riviere JE. Pharmacokinetics of melamine in pigs following intravenous administration. Food Chem Toxicol. 2008;46:1196–1200. - PubMed
-
- Bearden AP, Sinks GD, Schultz TW. Acclimation to sublethal exposures to a model nonpolar narcotic: population growth kinetics and membrane lipid alterations in Tetrahymena pyriformis. Aquat Toxicol. 1999;46:11–21.
-
- Beermann K, Buschmann HJ, Schollmeyer E. A calorimetric method for the rapid evaluation of toxic substances using Tetrahymena pyriformis. Thermochim Acta. 1999;337:65–69.
MeSH terms
Substances
LinkOut - more resources
Full Text Sources