. 2010 Oct 21;1(10):e85.
doi: 10.1038/cddis.2010.64.

Enhancer of Zeste homolog 2 (EZH2) is overexpressed in recurrent nasopharyngeal carcinoma and is regulated by miR-26a, miR-101, and miR-98

Affiliations

Enhancer of Zeste homolog 2 (EZH2) is overexpressed in recurrent nasopharyngeal carcinoma and is regulated by miR-26a, miR-101, and miR-98

N M Alajez et al. Cell Death Dis. .

Abstract

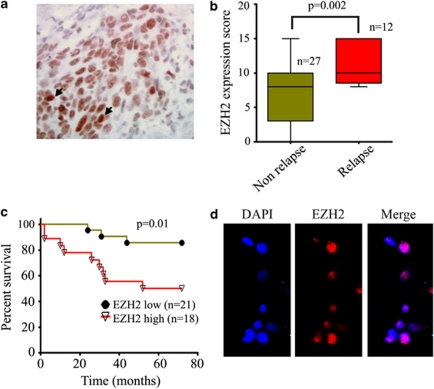
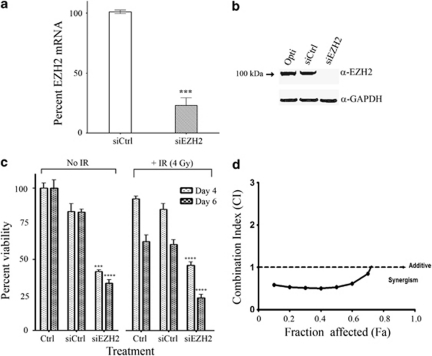
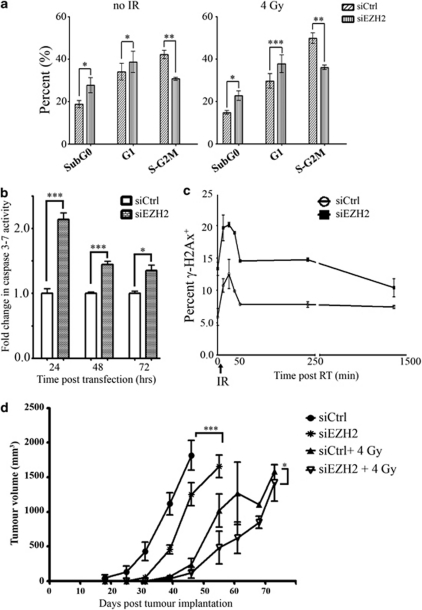
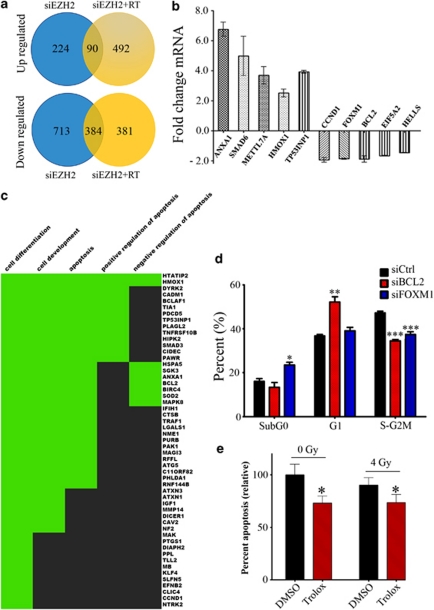
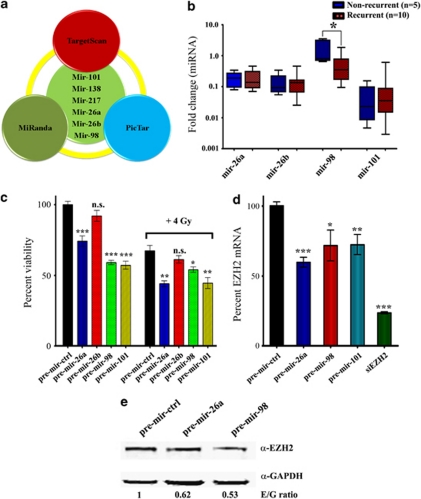
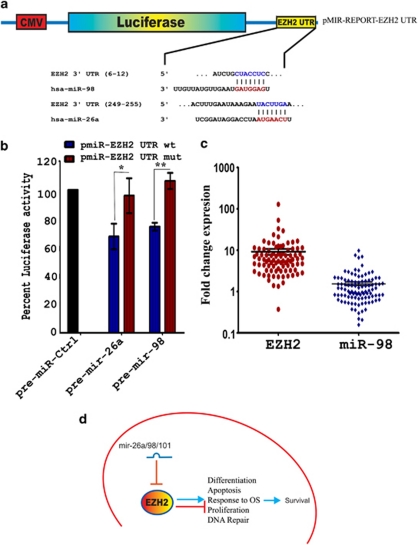
There is increasing evidence supporting the role of members of the polycomb group (PcG) gene family in tumor development and progression. However, their precise role in tumorigenesis and mechanisms of their regulation remain to be elucidated. Using nasopharyngeal carcinoma (NPC) as a disease model, a comprehensive analysis was undertaken on the clinical significance of EZH2 expression, identification of the cellular processes regulated by EZH2, and the mechanisms of its deregulated expression. Herein, we report EZH2 as being associated with a higher risk of relapse in NPC patients (P = 0.002). Genome-wide microarray and bioinformatics identified several vital cellular processes (such as differentiation, development, and apoptosis) to be regulated by EZH2, corroborated by in vitro lethality, and delayed tumor formation in vivo upon EZH2 depletion. The combination of global microRNA (miR) profiling in primary NPC specimens, and in silico analyses provided several candidate miRs that could regulate EZH2. Using a luciferase-based assay, miR-26a, miR-101, and miR-98 were validated as bona fide regulators of EZH2 expression. In particular, miR-98 was underexpressed in relapsed patient samples, strongly suggesting an important role for the miR-98 and EZH2 axis in NPC biology.


Figures

Figure 1
Figure 1
Overexpression of EZH2 is associated with poor clinical outcome in NPC (a) Representative immunohistochemical staining demonstrating expression of EZH2 (arrow) in the nuclei of NPC cells. (b) EZH2 is expressed at significantly higher levels in relapsed NPC compared with nonrelapsed patient tumors (cohort ‘A'). (c) Kaplan–Meier plot of overall survival in the same cohort as a function of EZH2 expression, using the median score of ≥10 (high) versus <10 (low). (d) Immunofluorescence overlay of EZH2 (red) and nuclear (blue) staining demonstrating nuclear expression of EZH2 in C666-1 cells
Figure 2
Figure 2
EZH2 is important for survival of NPC cells in vitro. (a) Reduction in EZH2 transcript level after transfection with siRNA (40 nM) targeting EZH2 relative to cells transfected with scrambled siRNA (40 nM), evaluated at 72 h post-transfection. The data are presented as mean ± S.E. from two independent experiments, n=6; ***P≤0.0005. (b) Western blot for EZH2 protein expression, also evaluated at 72 h post-transfection with siRNA targeting EZH2. (c) EZH2 depletion significantly reduced C666-1 cell viability at days 4 and day 6 post-transfection, which is further enhanced by IR (4 Gy). The data are presented as mean ± S.E. from two independent experiments, n=6; ***P≤0.0005; ****P≤0.00005. (d) Combination index analysis demonstrating more than additive interaction between EZH2 depletion and IR
Figure 3
Figure 3
EZH2 depletion induced apoptosis in C666-1 cells and delayed tumor growth in vivo. (a) C666-1 cells were transfected with siCtrl (40 nM) or siEZH2 (40 nM), then exposed to IR (4 Gy) on day 3; cell cycle analyses were conducted on day 4 post-transfection. Data are presented as the mean ± S.E. from two independent experiments, n=6; *P≤0.05; **P≤0.005; ***P≤0.0005. (b) Caspase 3/7 activity was measured at 24, 48, and 72 h post-transfection with the same siRNAs as in (a). Data are presented as the mean±S.E. from two independent experiments, n=4; *P≤0.05; ***P≤0.0005. (c) C666-1 cells were transfected with the same siRNAs as in (a), then exposed to IR (4 Gy) at 48 h post-transfection. The proportion of γ-H2AX expressing cells was measured at the indicated time points. Data are presented as the mean ± S.E. from two independent experiments, n=2. (d) C666-1 cells were transfected with siCtrl (40 nM), or siEZH2 (40 nM) for 72 h, then exposed to IR (4 Gy), followed by implantation in SCID mice on day 6 post-transfection. Tumor growth was then monitored over time. The data are presented as mean ± S.E. for each group of mice, each group consisting of 6 mice. Two-way ANOVA analysis was utilized to compare the difference in tumor growth between the indicated groups. *P≤0.05; ***P≤0.0005
Figure 4
Figure 4
Genome-wide microarray and pathway analyses reveal multiple pathways regulated by EZH2 in NPC. (a) Venn diagram showing the number of differentially expressed genes in cells depleted of EZH2 in the presence or absence of IR. C666-1 cells were transfected with siCtrl (40 nM) or siEZH2 (40 nM) for 48 h, then exposed to IR (4 Gy). RNA was extracted at 72 h post-transfection, then hybridized onto the Human Genome U133 Plus 2.0 Array. (b) A representative set of 10 differentially expressed genes validated using individual qRT-PCR, performed at 72 h post-transfection with siEZH2 (40 nM), compared with cells transfected with siCtrl (40 nM). Data are presented as mean ± S.E. from two independent experiments, n=6. (c) Heatmap displaying enrichment for genes involved in different cellular processes in EZH2-depleted cells; green color denotes association; black color denotes absence of association with the indicated cellular processes. (d) C666-1 cells were transfected with 40 nM of siCtrl, siBLC2, or siFOXM1, then cell cycle analyses were conducted at 72 h post-transfection. The proportion of cells in each stage of the cell cycle is indicated. Data are presented as mean±S.E. from two independent experiments compared with cells transfected with siCtrl, n=4; *P≤0.05; **P≤0.005; ***P≤0.0005. (e) C666-1 cells were transfected with siEZH2 (40 nM), then treated with Trolox (500 μM on day 1 and 500 μM on day 2). At 2 h after second Trolox treatment, half of the cells were then exposed to 4 Gy IR, and the percent of apoptosis was measured using flow cytometry on day 3. The data are presented as mean ± S.E. from two independent experiments, compared with DMSO-treated conditions, n=4; *P≤0.05
Figure 5
Figure 5
Negative regulation of EZH2 expression by miR-26a, 98, and 101. (a) Venn diagram showing the miRs that were predicted by all three databases (TargetScan, MiRanda, and PicTar), which can potentially regulate EZH2. (b) Fold change in miR-26a, 26b, 98, and 101 expression in 10 recurrent and 6 nonrecurrent primary NPC specimens compared with normal nasopharyngeal epithelial tissues (normalized to 1, on a log scale), evaluated in cohort ‘B'. (c) MTS viability for C666-1 cells on day 6 post-transfection with the indicated miRs (40 nM). IR (4 Gy) was delivered 24 h post-transfection. The data are presented as mean ± S.E. from two independent experiments, n=8; *P≤0.05; **P≤0.005; ***P≤0.0005. (d) qRT-PCR analysis of the fold-change in EZH2 mRNA expression 72 hrs post-transfection with the indicated miRs (all using 40 nM). Data are presented as mean ± S.E. from two independent experiments, n=6; *P≤0.05; **P≤0.005; ***P≤0.0005. (e) Western blot analysis for EZH2 expression in C666-1 cells at 72 h post-transfection with the indicated pre-miRs; E/G: ratio of EZH2/GAPDH
Figure 6
Figure 6
EZH2 3′-UTR is a direct target of miR-26a, 98, and 101. (a) Schematic representation of the pMIR-REPORT-EZH2 UTR expression vector with the alignment of the indicated miRs with the EZH2 3′-UTR with the seed region highlighted in blue (miR), and red (UTR). (b) Percent luciferase activity at 48 h post-transfection with the indicated miR (100 nM), and reporter plasmid (100 ng). Data are presented as mean ± S.E. from two independent experiments, n=4; *P≤0.05; **P≤0.005. (c) Inverse expression of EZH2 (n=89) with miR-98 (n=99) is observed in primary NPC specimens (cohort ‘C'), as measured by qRT-PCR and presented as fold-change expression in tumors compared with normal nasopharyngeal epithelial tissues (n=6). ***P≤0.0005. (d) A proposed model derived from these data, illustrating that underexpression of miR-26a, 98, and 101 lead to upregulation of EZH2, which in turn mediates several important cellular processes all driving the survival of NPC cells; (OS: oxidative stress)

References

    1. Kleer CG, Cao Q, Varambally S, Shen R, Ota I, Tomlins SA, et al. EZH2 is a marker of aggressive breast cancer and promotes neoplastic transformation of breast epithelial cells. Proc Natl Acad Sci USA. 2003;100:11606–11611. - PMC - PubMed
    1. Varambally S, Dhanasekaran SM, Zhou M, Barrette TR, Kumar-Sinha C, Sanda MG, et al. The polycomb group protein EZH2 is involved in progression of prostate cancer. Nature. 2002;419:624–629. - PubMed
    1. Villa R, Pasini D, Gutierrez A, Morey L, Occhionorelli M, Vire E, et al. Role of the polycomb repressive complex 2 in acute promyelocytic leukemia. Cancer Cell. 2007;11:513–525. - PubMed
    1. Levine SS, Weiss A, Erdjument-Bromage H, Shao Z, Tempst P, Kingston RE. The core of the polycomb repressive complex is compositionally and functionally conserved in flies and humans. Mol Cell Biol. 2002;22:6070–6078. - PMC - PubMed
    1. Bracken AP, Kleine-Kohlbrecher D, Dietrich N, Pasini D, Gargiulo G, Beekman C, et al. The Polycomb group proteins bind throughout the INK4A-ARF locus and are disassociated in senescent cells. Genes Dev. 2007;21:525–530. - PMC - PubMed

Publication types