

Cooperation and cheating in Pseudomonas aeruginosa: the roles of the las, rhl and pqs quorum-sensing systems
- PMID: 21368905
- PMCID: PMC3146268
- DOI: 10.1038/ismej.2011.13
Cooperation and cheating in Pseudomonas aeruginosa: the roles of the las, rhl and pqs quorum-sensing systems
Abstract
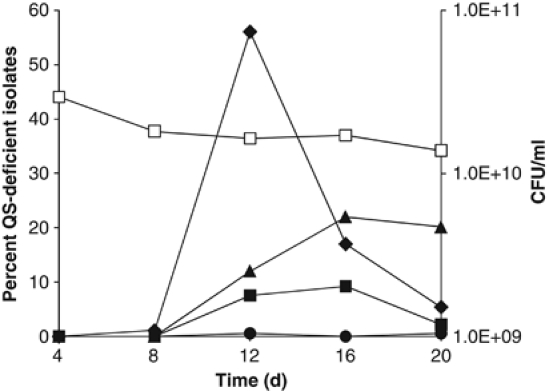
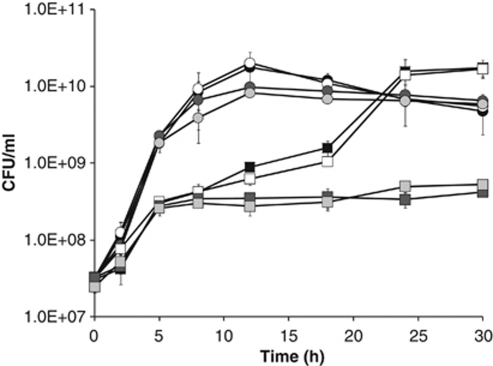
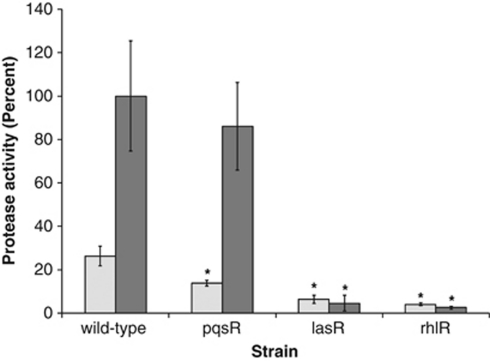
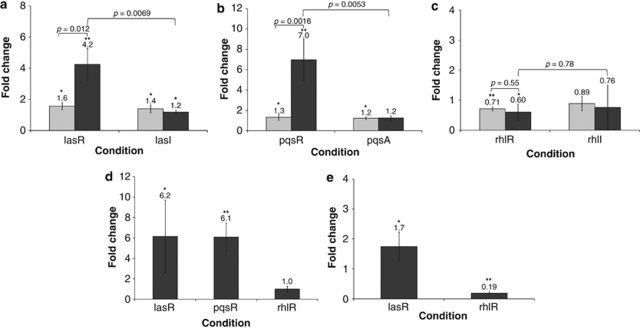
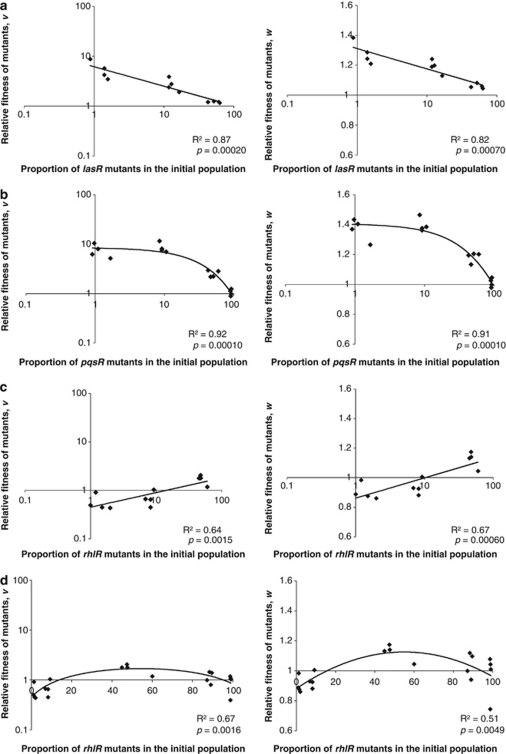
Pseudomonas aeruginosa coordinates the transcription of hundreds of genes, including many virulence genes, through three hierarchically arranged quorum-sensing (QS) systems, namely las, rhl and pqs. Each system consists of genes involved in autoinducer synthesis, lasI, rhlI and pqsABCDH, as well as cognate-regulatory genes, lasR, rhlR and pqsR. In this study, we analyzed the social behavior of signal-blind (ΔlasR, ΔrhlR, ΔpqsR) and signal-negative (ΔlasI, ΔrhlI, ΔpqsA) mutants from each QS system. As each system controls extracellular common goods but differs in the extent of regulatory control, we hypothesized that all signal-blind mutants can behave as cheaters that vary in their ability to invade a QS-proficient population. We found that lasR and pqsR, but not rhlR, mutants evolve from a wild-type ancestor in vitro under conditions that favor QS. Accordingly, defined lasR and pqsR mutants enriched in wild-type co-culture, whereas rhlR and all signal-negative mutants did not. Both lasR and pqsR mutants enriched with negative frequency dependence, suggesting social interactions with the wild type, although the pqsR mutant also grew well on its own. Taken together, the lasR mutant behaved as a typical cheater, as reported previously. However, the pqsR and rhlR mutants exhibited more complex behaviors, which can be sufficiently explained by positive and negative pleiotropic effects through differential regulation of pqs gene expression in the interconnected QS network. The evolutionary approach adopted here may account for the prevalence of naturally occurring QS mutants.
Figures

Similar articles
-
Growth phase-differential quorum sensing regulation of anthranilate metabolism in Pseudomonas aeruginosa.Mol Cells. 2011 Jul;32(1):57-65. doi: 10.1007/s10059-011-2322-6. Epub 2011 May 23. Mol Cells. 2011. PMID: 21614486 Free PMC article.
-
The relationship between pqs gene expression and acylhomoserine lactone signaling in Pseudomonas aeruginosa.J Bacteriol. 2024 Oct 24;206(10):e0013824. doi: 10.1128/jb.00138-24. Epub 2024 Sep 5. J Bacteriol. 2024. PMID: 39235221 Free PMC article.
-
RhlR-mediated cooperation in cystic fibrosis-adapted isolates of Pseudomonas aeruginosa.J Bacteriol. 2025 Jan 31;207(1):e0034424. doi: 10.1128/jb.00344-24. Epub 2024 Dec 13. J Bacteriol. 2025. PMID: 39670758 Free PMC article.
-
An evolving perspective on the Pseudomonas aeruginosa orphan quorum sensing regulator QscR.Front Cell Infect Microbiol. 2014 Oct 28;4:152. doi: 10.3389/fcimb.2014.00152. eCollection 2014. Front Cell Infect Microbiol. 2014. PMID: 25389523 Free PMC article. Review.
-
The third quorum-sensing system of Pseudomonas aeruginosa: Pseudomonas quinolone signal and the enigmatic PqsE protein.J Med Microbiol. 2020 Jan;69(1):25-34. doi: 10.1099/jmm.0.001116. J Med Microbiol. 2020. PMID: 31794380 Review.
Cited by
-
Exploring ComQXPA quorum-sensing diversity and biocontrol potential of Bacillus spp. isolates from tomato rhizoplane.Microb Biotechnol. 2015 May;8(3):527-40. doi: 10.1111/1751-7915.12258. Epub 2015 Mar 10. Microb Biotechnol. 2015. PMID: 25757097 Free PMC article.
-
Phenotypic heterogeneity unveils a negative correlation between antibiotic resistance and quorum sensing in Pseudomonas aeruginosa clinical isolates.Front Microbiol. 2024 Feb 12;15:1327675. doi: 10.3389/fmicb.2024.1327675. eCollection 2024. Front Microbiol. 2024. PMID: 38410387 Free PMC article.
-
Pseudomonas aeruginosa Quorum Sensing.Adv Exp Med Biol. 2022;1386:95-115. doi: 10.1007/978-3-031-08491-1_4. Adv Exp Med Biol. 2022. PMID: 36258070 Free PMC article.
-
Bacterial Cheaters Evade Punishment by Cyanide.iScience. 2019 Sep 27;19:101-109. doi: 10.1016/j.isci.2019.07.015. Epub 2019 Jul 16. iScience. 2019. PMID: 31357168 Free PMC article.
-
Microevolution of the mexT and lasR Reinforces the Bias of Quorum Sensing System in Laboratory Strains of Pseudomonas aeruginosa PAO1.Front Microbiol. 2022 Apr 12;13:821895. doi: 10.3389/fmicb.2022.821895. eCollection 2022. Front Microbiol. 2022. PMID: 35495693 Free PMC article.
References
-
- Bredenbruch F, Geffers R, Nimtz M, Buer J, Haussler S. The Pseudomonas aeruginosa quinolone signal (PQS) has an iron-chelating activity. Environ Microbiol. 2006;8:1318–1329. - PubMed
-
- Choi KH, Schweizer HP. Mini-Tn7 insertion in bacteria with secondary, non-glmS-linked attTn7 sites: example Proteus mirabilis HI4320. Nat Protoc. 2006;1:170–178. - PubMed
Publication types
MeSH terms
Substances
LinkOut - more resources
Full Text Sources
Research Materials
