

Development of a new pre- and post-processing tool (SADAPT-TRAN) for nonlinear mixed-effects modeling in S-ADAPT
- PMID: 21369876
- PMCID: PMC3085703
- DOI: 10.1208/s12248-011-9257-x
Development of a new pre- and post-processing tool (SADAPT-TRAN) for nonlinear mixed-effects modeling in S-ADAPT
Abstract
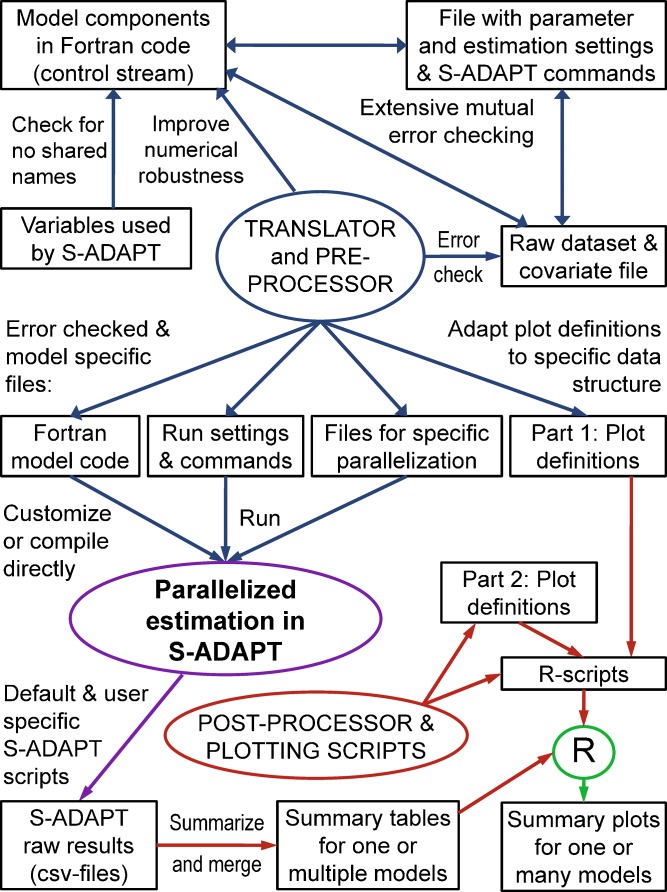
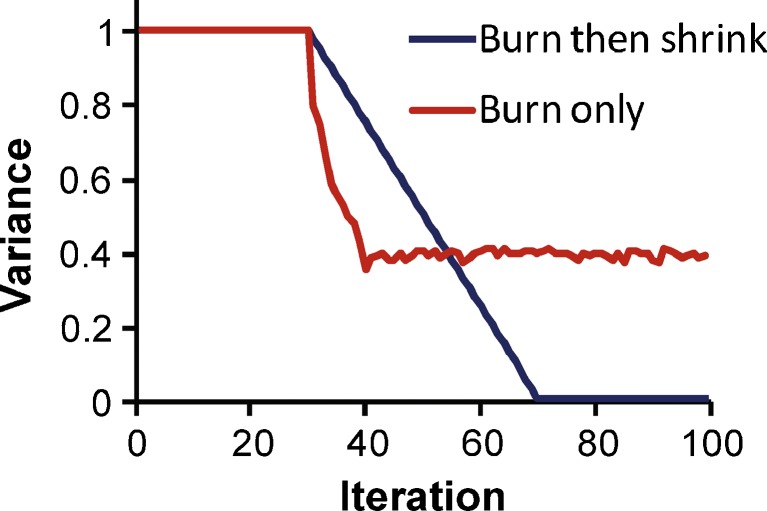
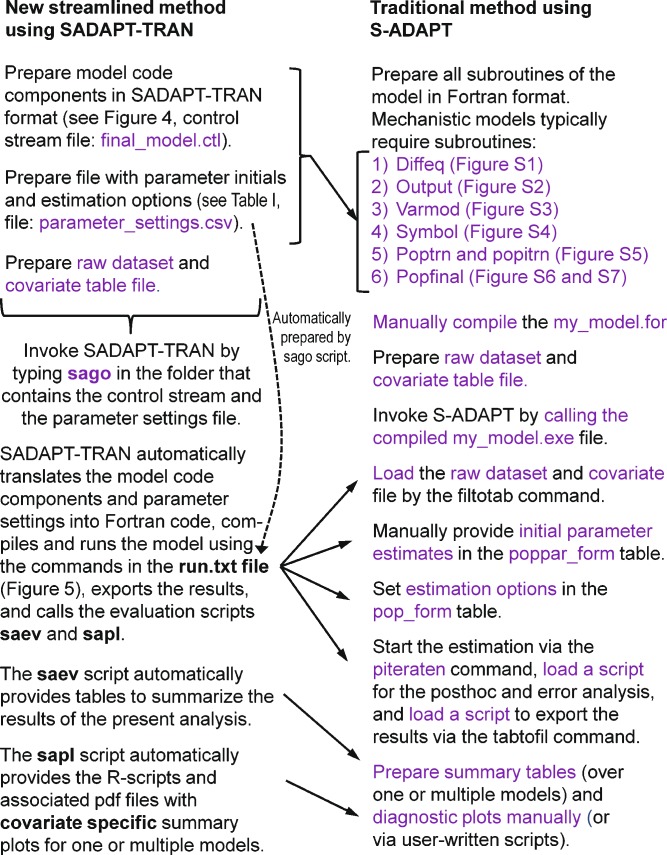
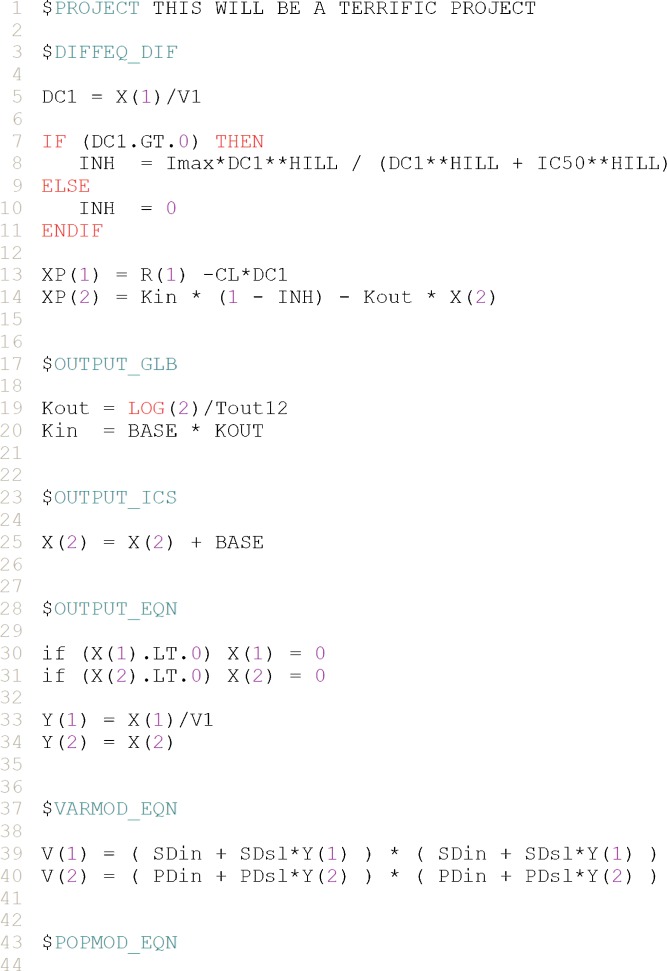
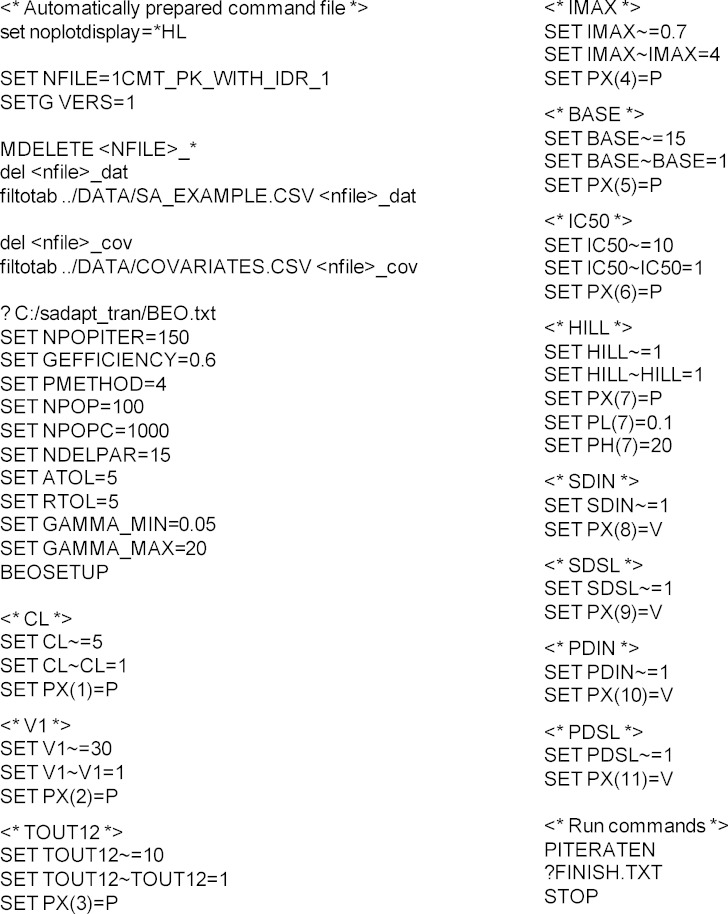
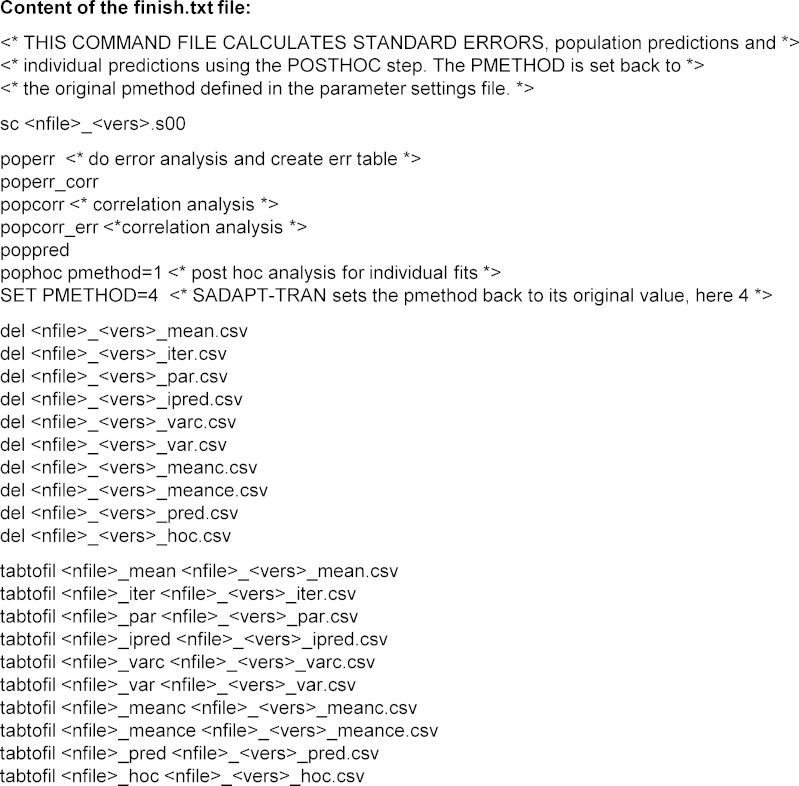
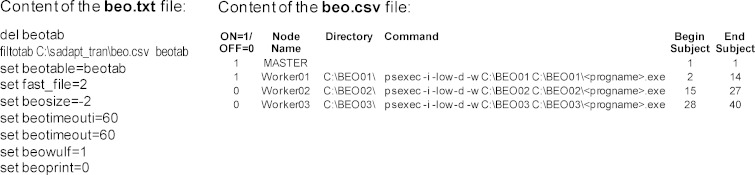
Mechanistic modeling greatly benefits from automated pre- and post-processing of model code and modeling results. While S-ADAPT provides many state-of-the-art parametric population estimation methods, its pre- and post-processing capabilities are limited. Our objective was to develop a fully automated, open-source pre- and post-processor for nonlinear mixed-effects modeling in S-ADAPT. We developed a new translator tool (SADAPT-TRAN) based on Perl scripts. These scripts (a) automatically translate the core model components into robust Fortran code, (b) perform extensive mutual error checks across all input files and the raw dataset, (c) extend the options of the Monte Carlo Parametric Expectation Maximization (MC-PEM) algorithm, and (d) improve the numerical robustness of the model code. The post-processing scripts automatically summarize the results of one or multiple models as tables and, by generating problem specific R scripts, provide an extended series of standard and covariate-stratified diagnostic plots. The SADAPT-TRAN package substantially improved the efficiency to specify, debug, and evaluate models and enhanced the flexibility of using the MC-PEM algorithm for parallelized estimation in S-ADAPT. The parameter variability model can take any combination of normally, log-normally, or logistically distributed parameters and the SADAPT-TRAN package can automatically generate the Fortran code required to specify between occasion variability. Extended estimation features are available to avoid local minima, estimate means with negligible variances, and estimate variances for fixed means. The SADAPT-TRAN package significantly facilitated model development in S-ADAPT, reduced model specification errors, and provided useful error messages for beginner and advanced users. This benefit was greatest for complex mechanistic models.
Figures
References
-
- Beal SL, Sheiner LB, Boeckmann AJ, Bauer RJ. NONMEM user’s guides (1989–2009) Ellicott City: Icon Development Solutions; 2009.
-
- Lavielle M. Monolix (Version 3.1)—A free software for the analysis of nonlinear mixed effects models. The Monolix Group. Paris; 2009.
-
- Lunn DJ, Wakefield J, Thomas A, Best N, Spiegelhalter D. PKBugs user guide. London: Imperial College School of Medicine; 1999.
MeSH terms
LinkOut - more resources
Full Text Sources
Other Literature Sources
Research Materials
