. 2011:719:547-71.
doi: 10.1007/978-1-61779-027-0_26.

Omics-based molecular target and biomarker identification

Affiliations

Omics-based molecular target and biomarker identification

Zhang-Zhi Hu et al. Methods Mol Biol. 2011.

Abstract

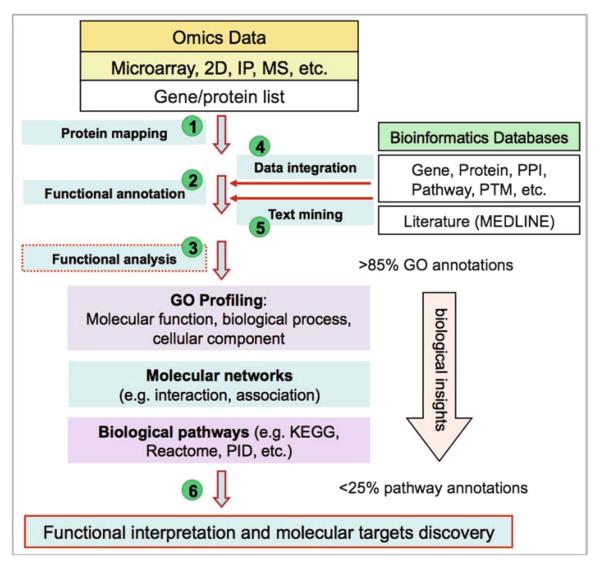
Genomic, proteomic, and other omic-based approaches are now broadly used in biomedical research to facilitate the understanding of disease mechanisms and identification of molecular targets and biomarkers for therapeutic and diagnostic development. While the Omics technologies and bioinformatics tools for analyzing Omics data are rapidly advancing, the functional analysis and interpretation of the data remain challenging due to the inherent nature of the generally long workflows of Omics experiments. We adopt a strategy that emphasizes the use of curated knowledge resources coupled with expert-guided examination and interpretation of Omics data for the selection of potential molecular targets. We describe a downstream workflow and procedures for functional analysis that focus on biological pathways, from which molecular targets can be derived and proposed for experimental validation.


Figures

Fig. 1
Fig. 1
A downstream functional analysis workflow for molecular target and biomarker discovery from Omics data.
Fig. 2
Fig. 2
iProXpress interface for browsing, searching, and functional profiling of Omics data. As an example, the interface displays the proteomic data sets derived from 2D gel and mass spectrometry as well as the gene expression microarray data sets from ATM (AT5BIVA) and ATM+ (ATCL8) human fibroblast cells (54).
Fig. 3
Fig. 3
GO biological process profiling of upregulated genes in ATCL8 cells (ATM+) at 30 min postirradiation. A total of 26 differentially expressed genes are profiled and the GO categories are ranked based on the number of proteins annotated with the corresponding GO terms (frequency); categories with only one protein are partially displayed at the bottom. Encircled in dashed line are top six categories of GO terms that cover 77% of the proteins (20/26), e.g., five genes appearing in three to five GO categories (in the box).
Fig. 4
Fig. 4
Comparative profiling of organellar proteomes using KEGG pathways. Proteomes of nine organelles (56) are profiled using KEGG pathways. Although only a small portion of the proteome is covered by the KEGG pathways, the profiles show striking contrast between organelles, e.g., endoplasmic reticulum (ER) and mitochondria (Mit) enriched for “oxidative phosphorylation” and “N-Glycan biosynthesis” pathways (encircled on the left), respectively.
Fig. 5
Fig. 5
(a) KEGG pathway profiling of radiation-induced protein expression changes in ATM mutated (ATM) and ATM wild type (ATM+) cells at 3 h postirradiation. The “purine metabolism” pathway is encircled and it shows that the most differentially changed proteins (up- or downregulated in response to radiation in the two cells) is found in this pathway. This profile is a partial display, with the rest having small number of proteins and no striking differences between groups. The figure is adapted from Hu et al. (54). (b) Mapping of radiation-induced protein changes onto the purine metabolic pathway. Enzymes in the KEGG reference map are represented using Enzyme Commission numbers (EC#, e.g., 1.17.4.1). Enzymes labeled with a diamond shape are those identified in human, and all others without such a label are those known to be absent in human. Enzymes with up-tilted arrows, upregulated in ATM+ cells; those with down-tilted arrows, downregulated in ATM cells; the enzyme with double down-tilted arrows are downregulated in both cells. Upper left, biochemical steps surrounding dADP/dATP; upper right, biochemical steps surrounding dGDP/dGTP; bottom, illustration of the rate-limiting step in dATP or dGTP synthesis from the reduction of ADP or GDP, respectively, catalyzed by RRM2 in human.
Fig. 6
Fig. 6
(a) Ingenuity pathway profiling and mapping of genes/proteins from ATM/ATM+ cells with or without ionizing radiation treatment. The analysis is performed using Ingenuity IPA. Top, top-ranked pathway profiles (well above the threshold p-value), in which the ratio of genes/proteins detected in the experiment over the total number of proteins annotated in the pathway, is given as gray squares. Purine metabolism (encircled on the left) is shown as the third top pathway in the study. Bottom, pathway map of cell cycle G2/M DNA damage check point regulation. BRCA1 and p53 are upregulated at mRNA level 30 min after irradiation in ATCL8 cells (labeled with a dark triangle shape). Chk1, identified from 2D gel/MS, was increased at 3 h after irradiation in ATCL8 cells (encircled with a dashed line). (b) Gene networks linking RRM2 with DNA damage repair pathway proteins. Functional networks showing RRM2 connected to other major DNA repair and cell cycle proteins, such as p53, BRCA1, and HDAC1. Networks are generated using the Ingenuity IPA tool, and are merged from three subnetworks, one containing RRM2 and HDAC1, one with p53, and the third with BRCA1. The protein or gene nodes labeled with a dark triangle shape are those differentially expressed in the study. The lines (edges) connecting nodes indicate associations between proteins or genes, which encompass interaction, binding, activation, inhibition, etc. Solid lines (edges) are for direct and dashed ones for indirect associations. The figure is adapted from Hu et al. (54).
Fig. 6
Fig. 6
(a) Ingenuity pathway profiling and mapping of genes/proteins from ATM/ATM+ cells with or without ionizing radiation treatment. The analysis is performed using Ingenuity IPA. Top, top-ranked pathway profiles (well above the threshold p-value), in which the ratio of genes/proteins detected in the experiment over the total number of proteins annotated in the pathway, is given as gray squares. Purine metabolism (encircled on the left) is shown as the third top pathway in the study. Bottom, pathway map of cell cycle G2/M DNA damage check point regulation. BRCA1 and p53 are upregulated at mRNA level 30 min after irradiation in ATCL8 cells (labeled with a dark triangle shape). Chk1, identified from 2D gel/MS, was increased at 3 h after irradiation in ATCL8 cells (encircled with a dashed line). (b) Gene networks linking RRM2 with DNA damage repair pathway proteins. Functional networks showing RRM2 connected to other major DNA repair and cell cycle proteins, such as p53, BRCA1, and HDAC1. Networks are generated using the Ingenuity IPA tool, and are merged from three subnetworks, one containing RRM2 and HDAC1, one with p53, and the third with BRCA1. The protein or gene nodes labeled with a dark triangle shape are those differentially expressed in the study. The lines (edges) connecting nodes indicate associations between proteins or genes, which encompass interaction, binding, activation, inhibition, etc. Solid lines (edges) are for direct and dashed ones for indirect associations. The figure is adapted from Hu et al. (54).

Similar articles

Cited by

References

    1. Ransohoff DF. Cancer. Developing molecular biomarkers for cancer. Science. 2003;299:1679–80. - PubMed
    1. Riesterer O, Milas L, Ang KK. Use of molecular biomarkers for predicting the response to radiotherapy with or without chemotherapy. J Clin Oncol. 2007;25:4075–83. - PubMed
    1. Kim YS, Maruvada P, Milner JA. Metabolomics in biomarker discovery: future uses for cancer prevention. Future Oncol. 2008;4:93–102. - PubMed
    1. Tainsky MA. Genomic and proteomic biomarkers for cancer: a multitude of opportunities. Biochim Biophys Acta. 2009;1796:176–93. - PMC - PubMed
    1. Hanash S. Integrated global profiling of cancer. Nat Rev Cancer. 2004;4:638–44. - PubMed

Publication types

LinkOut - more resources