

Fast fat-suppressed reduced field-of-view temperature mapping using 2DRF excitation pulses
- PMID: 21371923
- PMCID: PMC3085949
- DOI: 10.1016/j.jmr.2011.02.004
Fast fat-suppressed reduced field-of-view temperature mapping using 2DRF excitation pulses
Abstract
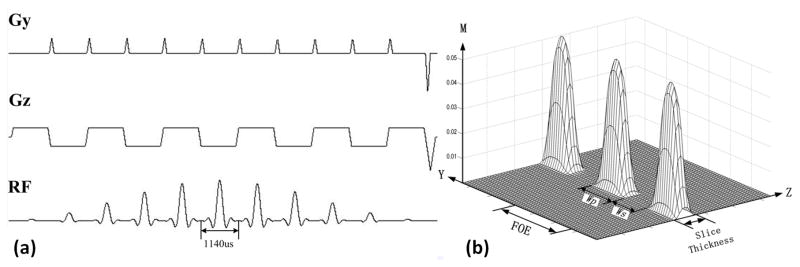
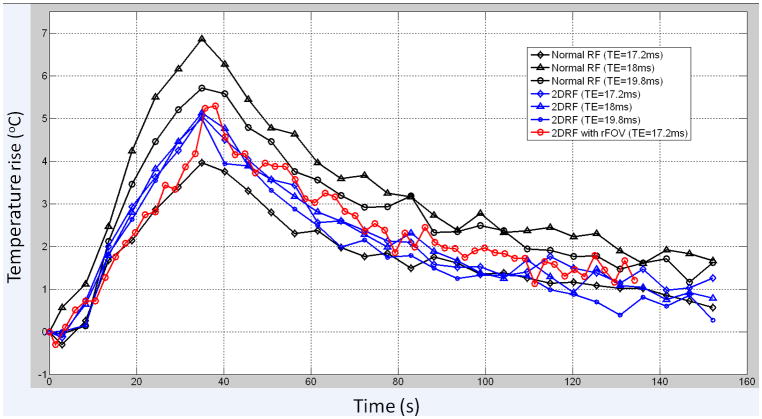
The purpose of this study is to develop a fast and accurate temperature mapping method capable of both fat suppression and reduced field-of-view (rFOV) imaging, using a two-dimensional spatially-selective RF (2DRF) pulse. Temperature measurement errors caused by fat signals were assessed, through simulations. An 11×1140μs echo-planar 2DRF pulse was developed and incorporated into a gradient-echo sequence. Temperature measurements were obtained during focused ultrasound (FUS) heating of a fat-water phantom. Experiments both with and without the use of a 2DRF pulse were performed at 3T, and the accuracy of the resulting temperature measurements were compared over a range of TE values. Significant inconsistencies in terms of measured temperature values were observed when using a regular slice-selective RF excitation pulse. In contrast, the proposed 2DRF excitation pulse suppressed fat signals by more than 90%, allowing good temperature consistency regardless of TE settings. Temporal resolution was also improved, from 12 frames per minute (fpm) with the regular pulse to 28 frames per minute with the rFOV excitation. This technique appears promising toward the MR monitoring of temperature in moving adipose organs, during thermal therapies.
Copyright © 2011 Elsevier Inc. All rights reserved.
Figures


References
-
- Parker DL, Smith V, Sheldon P, Crooks LE, Fussell L. Temperature distribution measurements in two-dimensional NMR imaging. Med Phys. 1983;10:321–325. - PubMed
-
- Dickinson RJ, Hall AS, Hind AJ, Young IR. Measurement of changes in tissue temperature using MR imaging. J Comput Assist Tomogr. 1986;10:468–472. - PubMed
-
- Chen J, Daniel BL, Pauly KB. Investigation of proton density for measuring tissue temperature. J Magn Reson Imaging. 2006;23:430–434. - PubMed
-
- Graham SJ, Stanisz GJ, Kecojevic A, Bronskill MJ, Henkelman RM. Analysis of changes in MR properties of tissues after heat treatment. Magn Reson Med. 1999;42:1061–1071. - PubMed
-
- Le Bihan D, Delannoy J, Levin RL. Temperature mapping with MR imaging of molecular diffusion: application to hyperthermia. Radiology. 1989;171:853–857. - PubMed
Publication types
MeSH terms
Substances
Grants and funding
LinkOut - more resources
Full Text Sources
