. 2011 May 6;286(18):15841-53.
doi: 10.1074/jbc.M110.209122. Epub 2011 Mar 3.

Endosomal targeting of the phosphoinositide 3-phosphatase MTMR2 is regulated by an N-terminal phosphorylation site

Affiliations

Endosomal targeting of the phosphoinositide 3-phosphatase MTMR2 is regulated by an N-terminal phosphorylation site

Norah E Franklin et al. J Biol Chem. .

Abstract

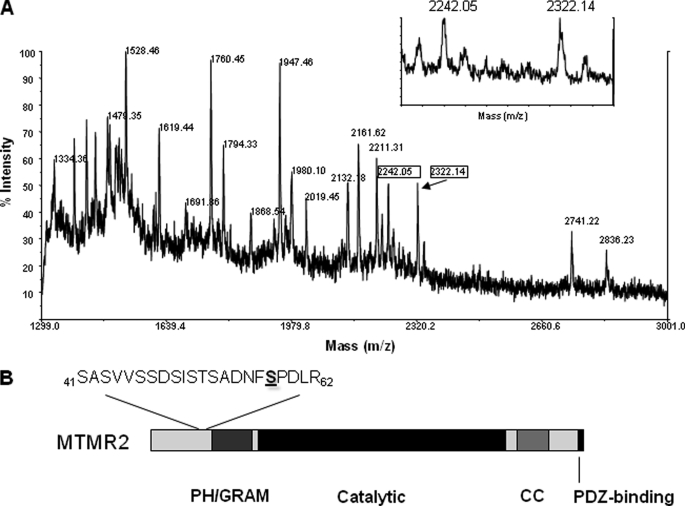
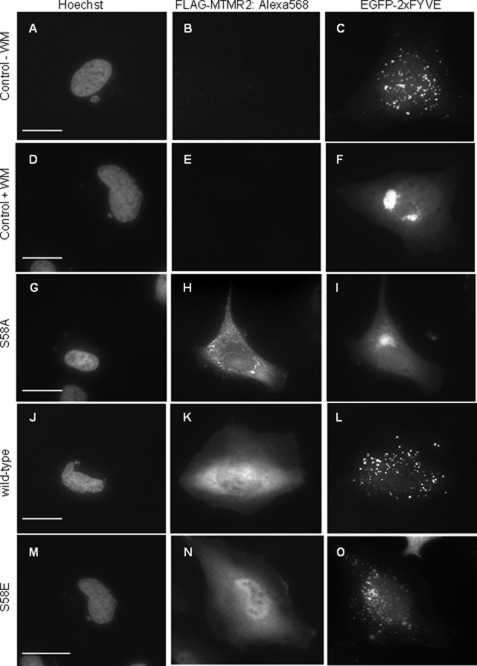
MTMR2 is a member of the myotubularin family of inositol lipid phosphatases, a large protein-tyrosine phosphatase subgroup that is conserved from yeast to humans. Furthermore, the peripheral neuromuscular disease Charcot-Marie Tooth disease type 4B has been attributed to mutations in the mtmr2 gene. Because the molecular mechanisms regulating MTMR2 have been poorly defined, we investigated whether reversible phosphorylation might regulate MTMR2 function. We used mass spectrometry-based methods to identify a high stoichiometry phosphorylation site on serine 58 of MTMR2. Phosphorylation at Ser(58), or a phosphomimetic S58E mutation, markedly decreased MTMR2 localization to endocytic vesicular structures. In contrast, a phosphorylation-deficient MTMR2 mutant (S58A) displayed constitutive localization to early endocytic structures. This localization pattern was accompanied by displacement of a PI(3)P-specific sensor protein and an increase in signal transduction pathways. Thus, MTMR2 phosphorylation is likely to be a critical mechanism by which MTMR2 access to its lipid substrate(s) is temporally and spatially regulated, thereby contributing to the control of downstream endosome maturation events.


Figures

FIGURE 1.
FIGURE 1.
MTMR2 possesses a high stoichiometry phosphorylation site within its N terminus. FLAG-tagged MTMR2 was isolated from HEK293 cells by immunoprecipitation. MTMR2 was also immunoprecipitated from a small scale culture of cells radiolabeled with [32P]orthophosphate. The labeled and unlabeled protein samples were combined and separated by SDS-PAGE. The MTMR2 band was excised from the gel and subjected to in-gel digestion with trypsin. A, MALDI-TOF linear spectrum of the total pool of MTMR2 tryptic peptides. The m/z values corresponding to the unphosphorylated and phosphorylated forms of peptide Ser41-Arg62 are boxed. This region is also shown as an expanded view. B, schematic diagram of MTMR2 indicating the proximity of the Ser58 phosphorylation site to the PH/GRAM, catalytic, coiled-coil (CC) domains, and the PDZ binding motif.
FIGURE 2.
FIGURE 2.
Mapping the N-terminal phosphorylation site using MALDI-CAF mass spectrometry. MTMR2 tryptic peptides were fractionated by reverse-phase HPLC. A, the HPLC fraction containing the phosphopeptide of interest was further analyzed by MALDI-TOF MS/MS. The neutral loss of the phosphate moiety (−98 m/z) is indicated. B, the same HPLC fraction was subjected to CAF labeling and re-analyzed by MALDI-TOF MS/MS. The fragment ions whose m/z value corresponds to y or b ions with the loss of a phosphate group are indicated. The observed fragment ions are labeled on the spectrum and peptide sequence (phosphorylated Ser58 is underlined and in bold text).
FIGURE 3.
FIGURE 3.
Lipid phosphatase activity and MTMR5 association are unaffected by the phosphorylation status of Ser58. A, phosphatase assays using purified recombinant MTMR2 proteins were carried out at 30 °C for 10 min with 50 ng of enzyme (■, wild-type; [gboc], S58A; dark grey, S58E) and 100 μm of the indicated phosphoinositide substrates as described under “Experimental Procedures.” Phosphate release was measured using a malachite green-based assay for inorganic phosphate. The relative amount of phosphate released by recombinant MTMR2 proteins in these assays is shown in picomoles and represents the mean of triplicate determinations ± S.D. (n = 3). B, co-immunoprecipitation of overexpressed FLAG-tagged MTMR5 and MTMR2 proteins from HEK293 cells. At 42 h post-transfection, cell lysates were prepared and subjected to immunoprecipitation (IP) using MTMR5 antibody conjugated to Protein A-agarose beads. Following SDS-PAGE, immunoprecipitated proteins were detected by immunoblotting (IB) using anti-FLAG antibody. Whole cell lysates were probed for MTMR5 and MTMR2 to verify protein expression.
FIGURE 4.
FIGURE 4.
MTMR2 S58A localizes to punctate structures. HeLa cells were transfected with FLAG-MTMR2 phosphorylation mutants: wild-type (A and B), S58A (C and D), S58E (E and F). Following fixation, the cells were immunostained with anti-FLAG monoclonal antibody to localize FLAG-MTMR2 proteins. Saponin treatment (right panels) (0.01%) was used to enhance detection of membrane-localized proteins via depletion of cytosolic contents. Images were collected using ×63 and ×40 HD objectives. The scale bar represents 15 μm (10 μm in expanded views). Boxes denote the regions corresponding to the expanded images (right).
FIGURE 5.
FIGURE 5.
Co-localization of MTMR2 S58A with the early endosomal protein Rab5. HeLa cells were transiently transfected with FLAG-MTMR2 S58A for 42 h and analyzed by immunofluorescence microscopy without saponin treatment (A–C), or with saponin treatment (D–F). Cells were probed for endogenous Rab5 (green) (A and D) and FLAG-MTMR2 S58A (red) (B and E). Merged images are shown to indicate partial co-localization (yellow) (C and F). Arrowheads indicate regions of interest and are presented in expanded views. Images were collected using ×63 (top panel) and ×40 oil (lower panel) objectives. The scale bar represents 15 μm (10 μm in expanded views).
FIGURE 6.
FIGURE 6.
Co-localization of catalytically inactive MTMR2 S58A. C417S with early endosome markers. HeLa cells were transiently transfected with FLAG-MTMR2 S58A alone or co-transfected with EGFP-2xFYVE (upper panel) for 42 h and analyzed by immunofluorescence microscopy with saponin treatment. Cells were probed for FLAG-MTMR2 S58A (red) and endogenous Rab5, Rab7, or LAMP1 (green). Merged images are shown on the right panels with yellow indicative of co-localization. Boxes indicate regions of interest and are presented in expanded views. Images were collected using ×63 objectives. The scale bar represents 15 μm (10 μm in expanded views).
FIGURE 7.
FIGURE 7.
MTMR2 S58A expression depletes PI(3)P from endosomes. HeLa cells were co-transfected with EGFP-2xFYVE and FLAG-MTMR2 phosphorylation mutants. After fixation, the cells were immunostained with anti-FLAG and Alexa Fluor® 568 anti-mouse secondary to detect MTMR2 proteins. Localization of the PI(3)P sensor EGFP-2xFYVE (right panels) on endosomes was detected as a punctate pattern. The punctate pattern is seen in control cells (A–C), and cells expressing wild-type MTMR2 (J–L) and S58E (M–O). The altered localization of the EGFP-2xFYVE marker was observed in both wortmanin-treated cells (D–F) and in cells expressing MTMR2 S58A (G–I). Images were collected using ×63 and × 40 HD objectives. The scale bar represents 15 μm.
FIGURE 8.
FIGURE 8.
Phosphorylation-deficient MTMR2 increases activation of EGF signaling. A, HeLa cells transfected with wild-type FLAG-MTMR2 and S58A were serum starved for 30 min and treated with 5 ng/ml of EGF for the indicated times. Lysates were immunoblotted (IB) for proteins phosphorylated in response to EGF treatment using the Pathscan® Multiplex antibody to detect phosphorylated proteins. Loading controls included total ERK1/2 and actin. FLAG-MTMR2 was immunostained with anti-FLAG to confirm equal MTMR2 expression levels in each of the samples. B, ERK1/2 phosphorylation levels were quantified by densitometry using Image J, and normalized to total ERK1/2 levels. The values indicate the mean ± S.D. (n = 3).
FIGURE 9.
FIGURE 9.
ERK1/2 activation enhanced by phosphorylation deficient MTMR2. A, HeLa and HEK293 cells were transfected with FLAG-MTMR2 expression vectors for 42 h. The cells were serum starved for 30 min and treated with 5 ng/ml of EGF for 5 min at 37 °C. ERK1/2 phosphorylation was determined by immunoblotting. Total ERK1/2 and actin levels served as loading controls. FLAG-MTMR2 immunoblotting was used to confirm equal transfection between samples. B, ERK1/2 phosphorylation was quantified by densitometry using the Image J program and normalized to total ERK1/2 levels (■, HeLa; formula image, HEK293). The values are shown as fold-change from control ± S.D. (n = 3).
FIGURE 10.
FIGURE 10.
Phosphorylation regulates endosomal targeting of MTMR2. Inhibition of MTMR2 Ser58 phosphorylation results in subcellular targeting to PI(3)P-positive endosomes, which leads to PI(3)P depletion and increased growth factor receptor signaling via endosomal pathways. Phosphorylation of Ser58 by a proline-directed kinase sequesters MTMR2 in the cytoplasm, thus preserving the levels of PI(3)P and promoting endosomal maturation/trafficking.

References

    1. Barford D., Das A. K., Egloff M. P. (1998) Annu. Rev. Biophys. Biomol. Struct. 27, 133–164 - PubMed
    1. Fauman E. B., Saper M. A. (1996) Trends Biochem. Sci. 21, 413–417 - PubMed
    1. Guan K. L., Broyles S. S., Dixon J. E. (1991) Nature 350, 359–362 - PubMed
    1. Guan K. L., Dixon J. E. (1991) J. Biol. Chem. 266, 17026–17030 - PubMed
    1. Taylor G. S., Maehama T., Dixon J. E. (2000) Proc. Natl. Acad. Sci. U.S.A. 97, 8910–8915 - PMC - PubMed

Publication types

MeSH terms

Substances