

Quantitative assessment of brain stem and cerebellar atrophy in spinocerebellar ataxia types 3 and 6: impact on clinical status
- PMID: 21372168
- PMCID: PMC7965570
- DOI: 10.3174/ajnr.A2387
Quantitative assessment of brain stem and cerebellar atrophy in spinocerebellar ataxia types 3 and 6: impact on clinical status
Abstract
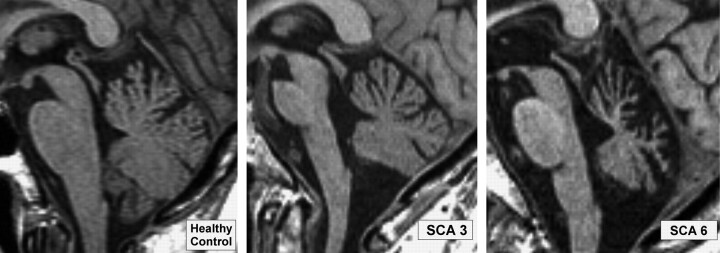
Background and purpose: Cerebellar and brain stem atrophy are important features in SCA3, whereas SCA6 has been regarded as a "pure" cerebellar disease. However, recent neuropathologic studies have described additional brain stem involvement in SCA6. We, therefore, aimed to investigate the occurrence and impact of regional infratentorial brain volume differences in patients with SCA3 and SCA6.
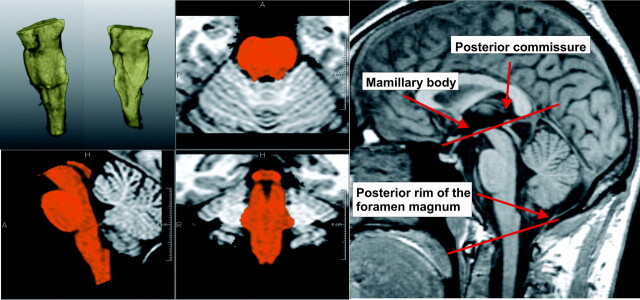
Materials and methods: Thirty-four patients with genetically proved SCA (SCA3, n = 17; SCA6, n = 17) and age-matched healthy control subjects (n = 51) were included. In all subjects, high-resolution T1-weighted images were acquired with a 1.5T MR imaging scanner. Individual brain stem and cerebellar volumes were calculated by using semiautomated volumetry approaches. For all patients with SCA, clinical dysfunction was scored according to the ICARS. Multiple regression analysis was used to identify the contribution of regional volumes to explain the variance in clinical dysfunction in each SCA genotype.
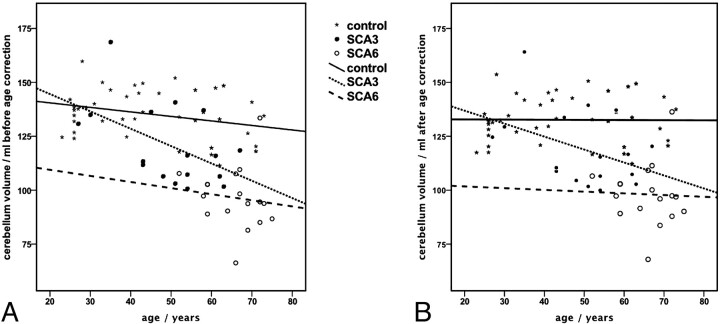
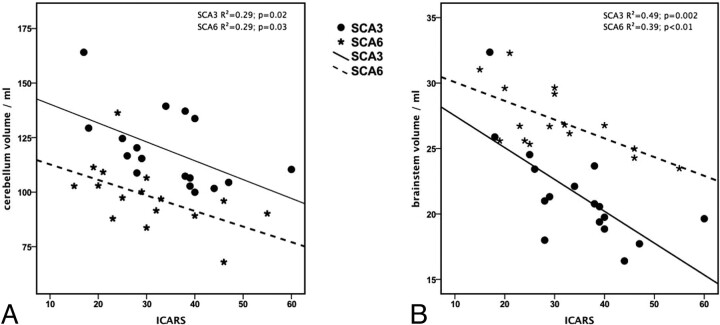
Results: Cerebellar volumes were lower in patients with SCA6 compared with controls and with those with SCA3. In contrast to controls, brain stem volume loss was observed in patients with SCA3 (P < .001) and, to a lesser extent, in those with SCA6 (P = .027). Significant linear dependencies were found between ICARS and cerebellum volume (SCA3: R(2) = 0.29, P = .02; SCA6: R(2) = 0.29, P = .03) and between ICARS and brain stem volume (SCA3: R(2) = 0.49, P = .002; SCA6: R(2) = 0.39, P < .01) in both subtypes. Both cerebellar and brain stem atrophy contributed independently to the variance in clinical dysfunction in SCA6, while in SCA3, only brain stem atrophy was of relevance.
Conclusions: Our current findings in accordance with recent neuroradiologic and pathoanatomic studies suggest brain stem and cerebellar volume loss as attractive surrogate markers of disease severity in SCA3 and SCA6.
Figures
References
-
- Schöls L, Bauer P, Schmidt T, et al. . Autosomal dominant cerebellar ataxias: clinical features, genetics, and pathogenesis. Lancet Neurol 2004; 3: 291–304 - PubMed
-
- Brenneis C, Bosch SM, Schocke M, et al. . Atrophy pattern in SCA2 determined by voxel-based morphometry. Neuroreport 2003; 14: 1799–802 - PubMed
-
- Della Nave R, Ginestroni A, Tessa C, et al. . Brain white matter damage in SCA1 and SCA2: an in vivo study using voxel-based morphometry, histogram analysis of mean diffusivity and tract-based spatial statistics. Neuroimage 2008; 43: 10–19 - PubMed
-
- Klockgether T, Skalej M, Wedekind D, et al. . Autosomal dominant cerebellar ataxia type I: MRI-based volumetry of posterior fossa structures and basal ganglia in spinocerebellar ataxia types 1, 2 and 3. Brain 1998; 121: 1687–93 - PubMed
-
- Schulz JB, Borkert J, Wolf S, et al. . Visualization, quantification and correlation of brain atrophy with clinical symptoms in spinocerebellar ataxia types 1, 3 and 6. Neuroimage 2010; 49: 158–68 - PubMed
MeSH terms
LinkOut - more resources
Full Text Sources
Medical