

Calibration belt for quality-of-care assessment based on dichotomous outcomes
- PMID: 21373178
- PMCID: PMC3043050
- DOI: 10.1371/journal.pone.0016110
Calibration belt for quality-of-care assessment based on dichotomous outcomes
Abstract
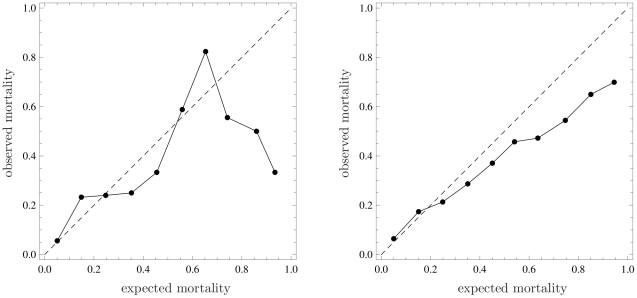
Prognostic models applied in medicine must be validated on independent samples, before their use can be recommended. The assessment of calibration, i.e., the model's ability to provide reliable predictions, is crucial in external validation studies. Besides having several shortcomings, statistical techniques such as the computation of the standardized mortality ratio (SMR) and its confidence intervals, the Hosmer-Lemeshow statistics, and the Cox calibration test, are all non-informative with respect to calibration across risk classes. Accordingly, calibration plots reporting expected versus observed outcomes across risk subsets have been used for many years. Erroneously, the points in the plot (frequently representing deciles of risk) have been connected with lines, generating false calibration curves. Here we propose a methodology to create a confidence band for the calibration curve based on a function that relates expected to observed probabilities across classes of risk. The calibration belt allows the ranges of risk to be spotted where there is a significant deviation from the ideal calibration, and the direction of the deviation to be indicated. This method thus offers a more analytical view in the assessment of quality of care, compared to other approaches.
Conflict of interest statement
Figures
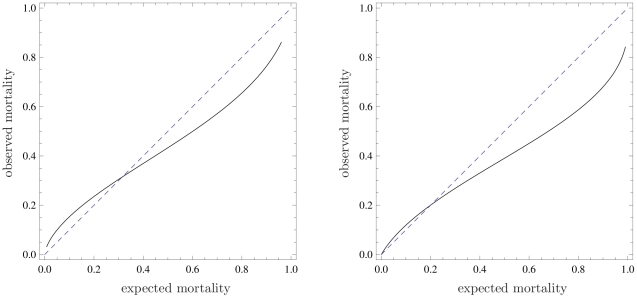
 for the
left curve and
for the
left curve and  for the
right one. To avoid extrapolation the curve have been plotted in the
range of mortality where data are present. Refer to the caption of Fig. 1 for information
about the data sets.
for the
right one. To avoid extrapolation the curve have been plotted in the
range of mortality where data are present. Refer to the caption of Fig. 1 for information
about the data sets.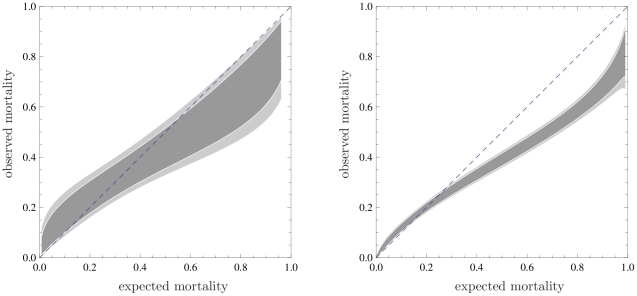
 (dark shaded area) and
 (light shaded area);
 for the
first example (left panel),
for the
first example (left panel),  for the
second (right panel). bisector (dashed line). As in
Fig. 2, the
calibrations bands have been plotted in the range of mortality where
data are present. Refer to the caption of Fig. 1 for information about the data
sets.
for the
second (right panel). bisector (dashed line). As in
Fig. 2, the
calibrations bands have been plotted in the range of mortality where
data are present. Refer to the caption of Fig. 1 for information about the data
sets.Similar articles
-
Community-wide assessment of intensive care outcomes using a physiologically based prognostic measure: implications for critical care delivery from Cleveland Health Quality Choice.Chest. 1999 Mar;115(3):793-801. doi: 10.1378/chest.115.3.793. Chest. 1999. PMID: 10084494
-
External validation of the SAPS II, APACHE II and APACHE III prognostic models in South England: a multicentre study.Intensive Care Med. 2003 Feb;29(2):249-56. doi: 10.1007/s00134-002-1607-9. Epub 2003 Jan 18. Intensive Care Med. 2003. PMID: 12536271
-
[Prognostic estimation in critical patients. Validation of a new and very simple system of prognostic estimation of survival in an intensive care unit].Med Intensiva. 2006 Apr;30(3):101-8. doi: 10.1016/s0210-5691(06)74482-5. Med Intensiva. 2006. PMID: 16729477 Spanish.
-
A discussion of calibration techniques for evaluating binary and categorical predictive models.Prev Vet Med. 2018 Jan 1;149:107-114. doi: 10.1016/j.prevetmed.2017.11.018. Epub 2017 Nov 24. Prev Vet Med. 2018. PMID: 29290291 Review.
-
Methods to assess performance of models estimating risk of death in intensive care patients: a review.Anaesth Intensive Care. 2006 Apr;34(2):164-75. doi: 10.1177/0310057X0603400205. Anaesth Intensive Care. 2006. PMID: 16617636 Review.
Cited by
-
Development and validation of a prognosis risk score model for neonatal mortality in the Amhara region, Ethiopia. A prospective cohort study.Glob Health Action. 2024 Dec 31;17(1):2392354. doi: 10.1080/16549716.2024.2392354. Epub 2024 Aug 30. Glob Health Action. 2024. PMID: 39210735 Free PMC article.
-
External validation of the Malaria Scoring System in a non-endemic emergency department.Intern Emerg Med. 2025 Jul 17. doi: 10.1007/s11739-025-04044-9. Online ahead of print. Intern Emerg Med. 2025. PMID: 40676453
-
Predicting the individualized risk of poor adherence to ART medication among adolescents living with HIV in Uganda: the Suubi+Adherence study.J Int AIDS Soc. 2021 Jun;24(6):e25756. doi: 10.1002/jia2.25756. J Int AIDS Soc. 2021. PMID: 34105865 Free PMC article.
-
Predicting tumor deposits in rectal cancer: a combined deep learning model using T2-MR imaging and clinical features.Insights Imaging. 2023 Dec 20;14(1):221. doi: 10.1186/s13244-023-01564-w. Insights Imaging. 2023. PMID: 38117396 Free PMC article.
-
Use of electronic medical records in development and validation of risk prediction models of hospital readmission: systematic review.BMJ. 2020 Apr 8;369:m958. doi: 10.1136/bmj.m958. BMJ. 2020. PMID: 32269037 Free PMC article.
References
-
- Donabedian A. The quality of care. how can it be assessed? JAMA. 1988;260:1743–1748. - PubMed
-
- Wyatt J, Altman D. Prognostic models: clinically useful or quickly forgotten? Bmj. 1995;311:1539–1541.
-
- Lemeshow S, Hosmer D. A review of goodness of fit statistics for use in the development of logistic regression models. Am J Epidemiol. 1982;115:92–106. - PubMed
-
- Bertolini G, D'Amico R, Nardi D, Tinazzi A, Apolone G, et al. One model, several results: the paradox of the hosmer–lemeshow goodness-of-fit test for the logistic regression model. J Epidemiol Biostat. 2000;5:251–253. - PubMed
-
- Kramer A, Zimmerman J. Assessing the calibration of mortality benchmarks in critical care: The hosmer–lemeshow test revisited. Crit Care Med. 2007;35:2052–2056. - PubMed
Publication types
MeSH terms
LinkOut - more resources
Full Text Sources
Molecular Biology Databases
