

doi: 10.1257/jep.23.4.119.
Playing the Admissions Game: Student Reactions to Increasing College Competition
Affiliations
- PMID: 21373378
- PMCID: PMC3046867
- DOI: 10.1257/jep.23.4.119
Item in Clipboard
Playing the Admissions Game: Student Reactions to Increasing College Competition
J Econ Perspect.
2009 Fall.
No abstract available
Figures
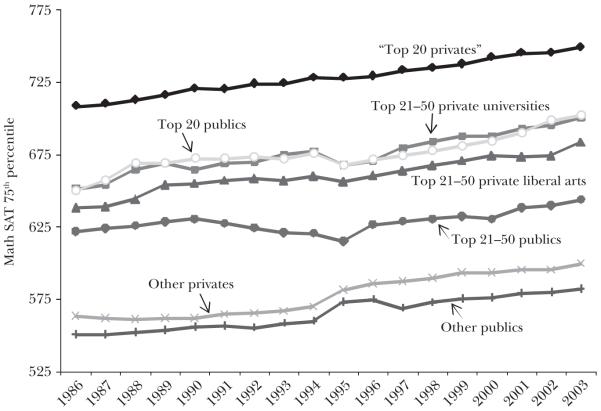
Source: American Survey of Colleges, College Board, 1986–87 to 2003–04. Notes: The figure displays trends in the 75th percentile math SAT score of schools’ student bodies; the results are broken down by institutional sector and ranking. The “Top 20 privates” category includes the top 20 private universities and top 20 liberal arts colleges. To be included in the sample, institutions must have had at least 16 of the 18 possible years of data.
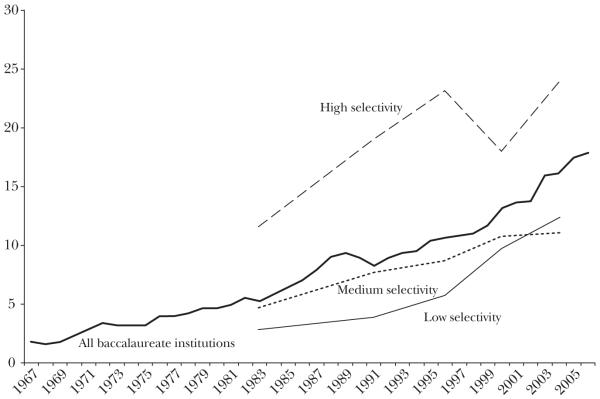
Source: The American Freshman, Cooperative Institutional Research Program (CIRP), various years. Notes: CIRP attempts to make its sample nationally representative by stratifying participating schools by control, highest degree awarded, and selectivity, and then weighting responses to population totals from the Integrated Postsecondary Education Data System (IPEDS). The selectivity metric used is time-varying and based on mean composite SAT score (or ACT equivalent). As a rule of thumb, high selectivity is fairly similar to our combined select private and select publics.
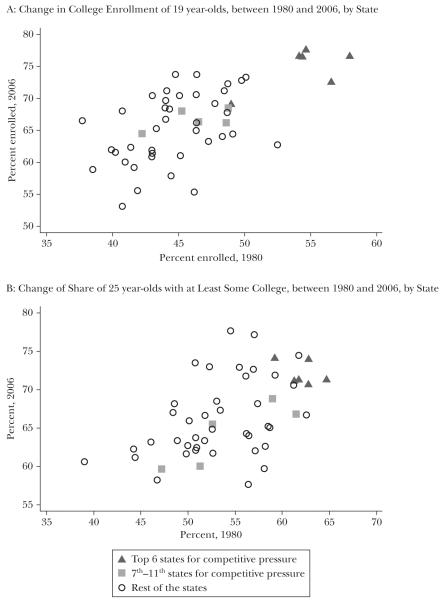
Source: Integrated Public-Use Microdata for the 1980 Census and the 2005–02007 American Community Surveys. Notes: We created a composite index of competitive pressure for each of the 50 states plus the District of Columbia. The index of competitive pressure is defined as the sum of the fraction of students who engaged in each of the following in 1992: took the PSAT, took an AP exam, spent 10+ hours on homework per week, used private test preparation services, and applied to five or more colleges. The top six “states” from this index are New Jersey, Rhode Island, the District of Columbia., Connecticut, Massachusetts, and New York. The states ranked seventh through eleventh are Delaware, Virginia, California, Colorado, and Georgia.
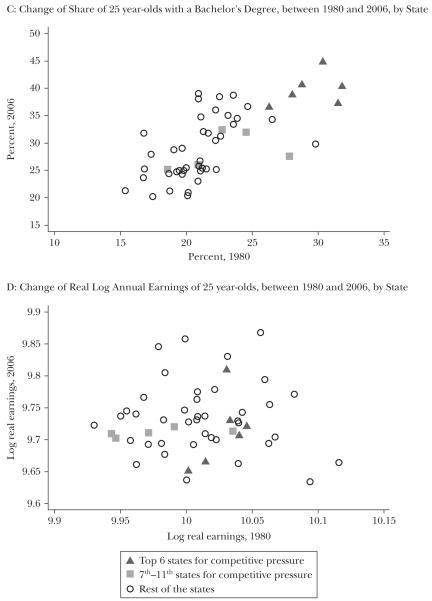
Source: Integrated Public-Use Microdata for the 1980 Census and the 2005–02007 American Community Surveys. Notes: We created a composite index of competitive pressure for each of the 50 states plus the District of Columbia. The index of competitive pressure is defined as the sum of the fraction of students who engaged in each of the following in 1992: took the PSAT, took an AP exam, spent 10+ hours on homework per week, used private test preparation services, and applied to five or more colleges. The top six “states” from this index are New Jersey, Rhode Island, the District of Columbia., Connecticut, Massachusetts, and New York. The states ranked seventh through eleventh are Delaware, Virginia, California, Colorado, and Georgia.
References
-
- Abrams Samuel J. Unflagged SATs. Education Next. 2005 Summer5(3)
-
- Ariely Dan, Gneezy Uri, Loewenstein George, Mazar Nina. Large Stakes and Big Mistakes. Review of Economic Studies. 2009;76(2):451–469.
-
- Bound John, Lovenheim Michael, Turner Sarah E. Population Studies Center Research Report 07-626. University of Michigan; 2007. Understanding the Decrease in College Completion Rates and the Increased Time to the Baccalaureate Degree.
-
- Bound John, Lovenheim Michael F., Turner Sarah. Why Have College Completion Rates Declined? The Effects of Changes in Students and Changes in Colleges. 2008. http://www.human.cornell.edu/che/PAM/People/upload/CR_Website.pdf. - PMC - PubMed
Grants and funding
LinkOut - more resources
Full Text Sources