

Positron emission tomography imaging of CD105 expression during tumor angiogenesis
- PMID: 21373764
- PMCID: PMC3105181
- DOI: 10.1007/s00259-011-1765-5
Positron emission tomography imaging of CD105 expression during tumor angiogenesis
Abstract
Purpose: Overexpression of CD105 (endoglin) correlates with poor prognosis in many solid tumor types. Tumor microvessel density (MVD) assessed by CD105 staining is the current gold standard for evaluating tumor angiogenesis in the clinic. The goal of this study was to develop a positron emission tomography (PET) tracer for imaging CD105 expression.
Methods: TRC105, a chimeric anti-CD105 monoclonal antibody, was conjugated to 1,4,7,10-tetraazacyclododecane-1,4,7,10-tetraacetic acid (DOTA) and labeled with (64)Cu. FACS analysis and microscopy studies were performed to compare the CD105 binding affinity of TRC105 and DOTA-TRC105. PET imaging, biodistribution, blocking, and ex vivo histology studies were performed on 4T1 murine breast tumor-bearing mice to evaluate the ability of (64)Cu-DOTA-TRC105 to target tumor angiogenesis. Another chimeric antibody, cetuximab, was used as an isotype-matched control.
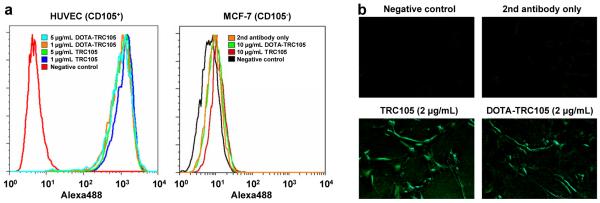
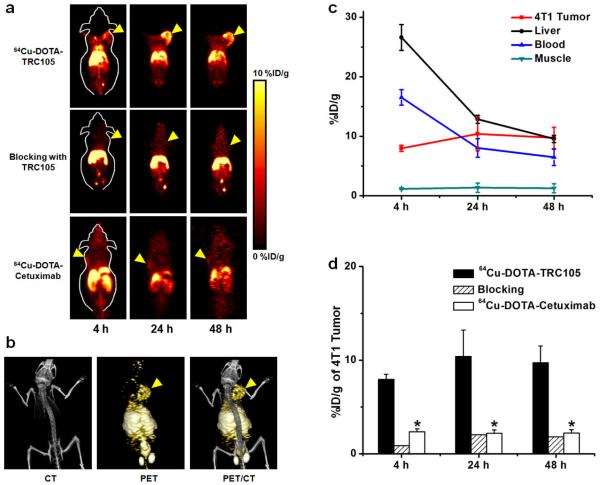
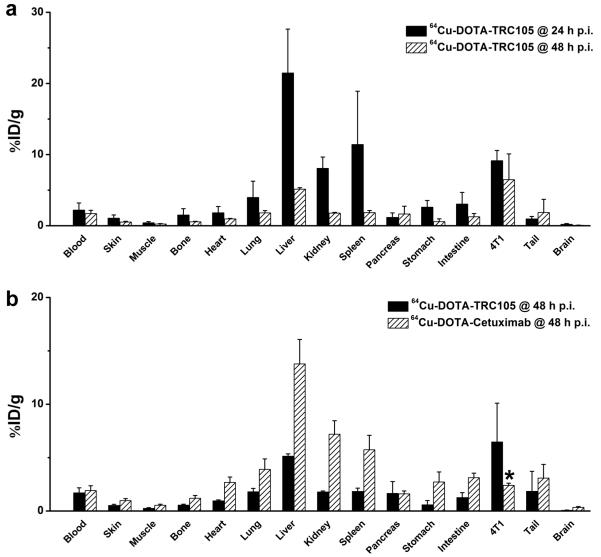
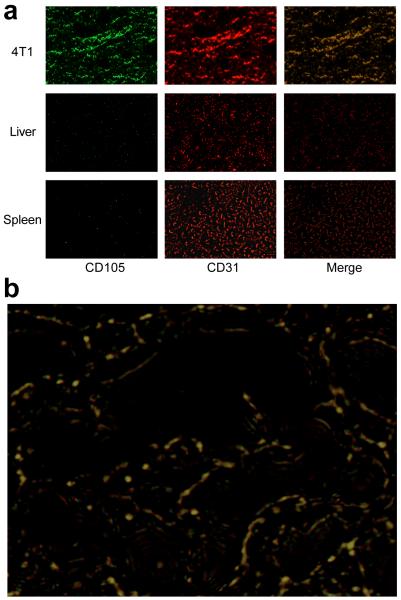
Results: FACS analysis of human umbilical vein endothelial cells (HUVECs) revealed no difference in CD105 binding affinity between TRC105 and DOTA-TRC105, which was further validated by fluorescence microscopy. (64)Cu labeling was achieved with high yield and specific activity. Serial PET imaging revealed that the 4T1 tumor uptake of the tracer was 8.0 ± 0.5, 10.4 ± 2.8, and 9.7 ± 1.8%ID/g at 4, 24, and 48 h post-injection, respectively (n = 3), higher than most organs at late time points which provided excellent tumor contrast. Biodistribution data as measured by gamma counting were consistent with the PET findings. Blocking experiments, control studies with (64)Cu-DOTA-cetuximab, as well as ex vivo histology all confirmed the in vivo target specificity of (64)Cu-DOTA-TRC105.
Conclusion: This is the first successful PET imaging study of CD105 expression. Fast, prominent, persistent, and CD105-specific uptake of the tracer in the 4T1 tumor was observed. Further studies are warranted and currently underway.
Figures
References
-
- Carmeliet P. Angiogenesis in life, disease and medicine. Nature. 2005;438:932–6. - PubMed
-
- Folkman J. Angiogenesis in cancer, vascular, rheumatoid and other disease. Nat Med. 1995;1:27–31. - PubMed
-
- Cai W, Chen X. Multimodality imaging of vascular endothelial growth factor and vascular endothelial growth factor receptor expression. Front Biosci. 2007;12:4267–79. - PubMed
-
- Cai W, Niu G, Chen X. Imaging of integrins as biomarkers for tumor angiogenesis. Curr Pharm Des. 2008;14:2943–73. - PubMed
-
- Dijkgraaf I, Boerman OC. Radionuclide imaging of tumor angiogenesis. Cancer Biother Radiopharm. 2009;24:637–47. - PubMed
Publication types
MeSH terms
Substances
Grants and funding
LinkOut - more resources
Full Text Sources
Other Literature Sources
Medical
