Clinical Trial
. 2011 Apr;153(2):222-35.
doi: 10.1111/j.1365-2141.2011.08591.x. Epub 2011 Mar 6.

Bortezomib interacts synergistically with belinostat in human acute myeloid leukaemia and acute lymphoblastic leukaemia cells in association with perturbations in NF-κB and Bim

Affiliations
Clinical Trial

Bortezomib interacts synergistically with belinostat in human acute myeloid leukaemia and acute lymphoblastic leukaemia cells in association with perturbations in NF-κB and Bim

Yun Dai et al. Br J Haematol. 2011 Apr.

Abstract

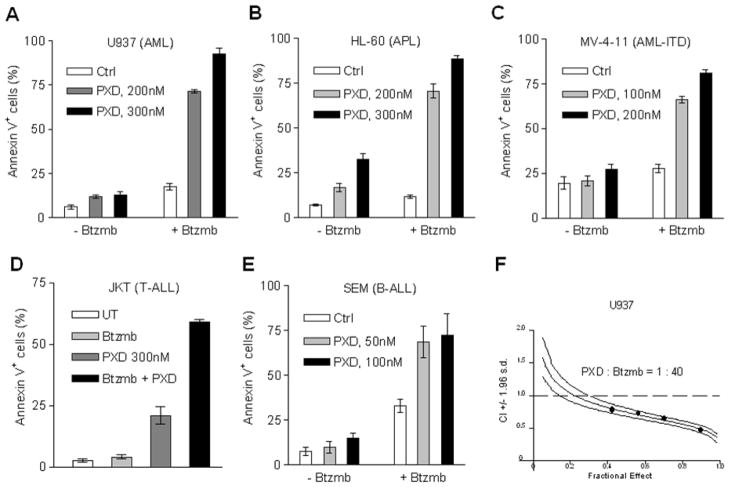
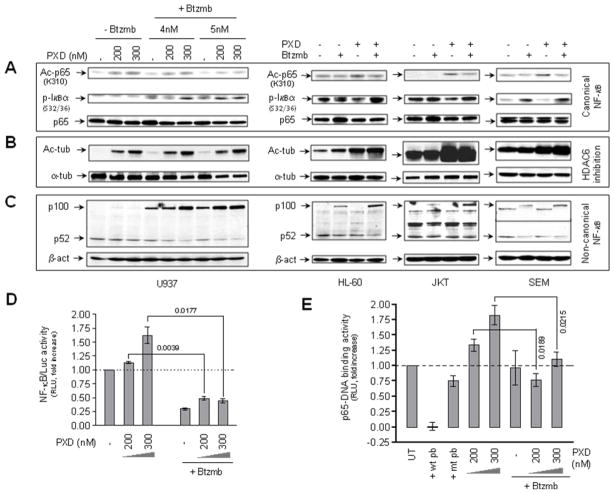
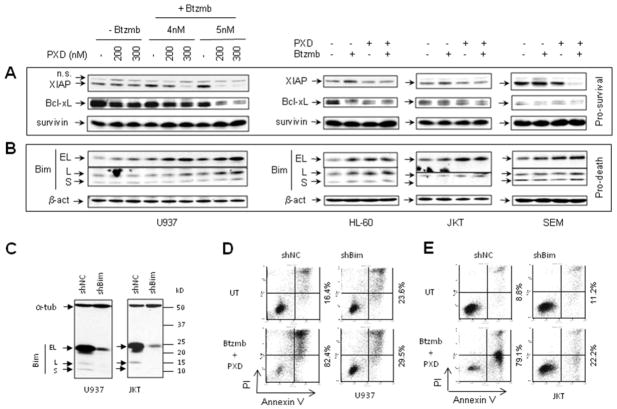
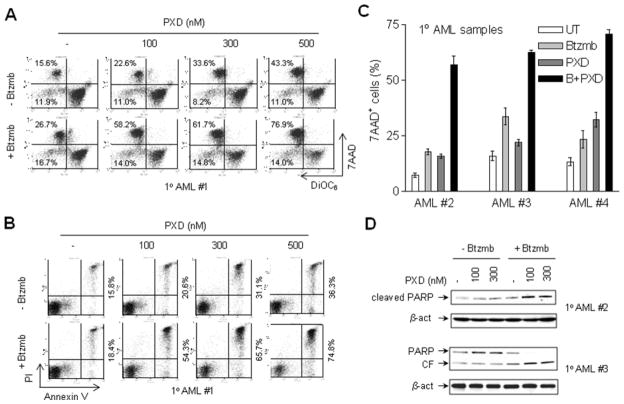
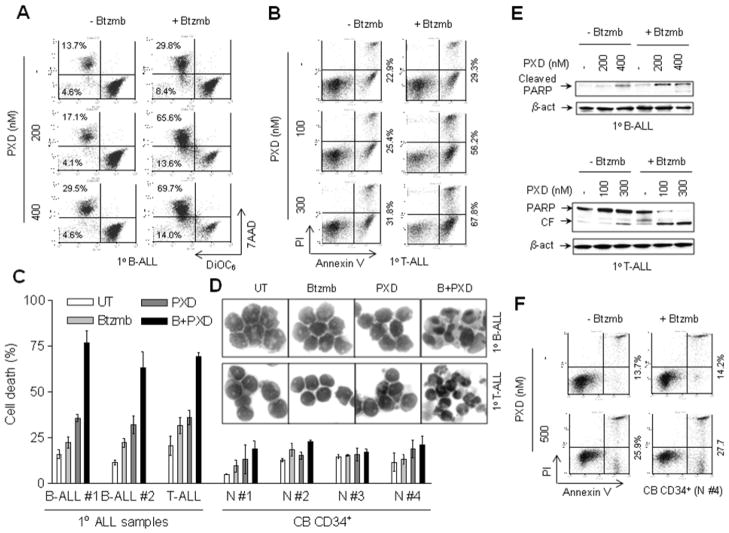
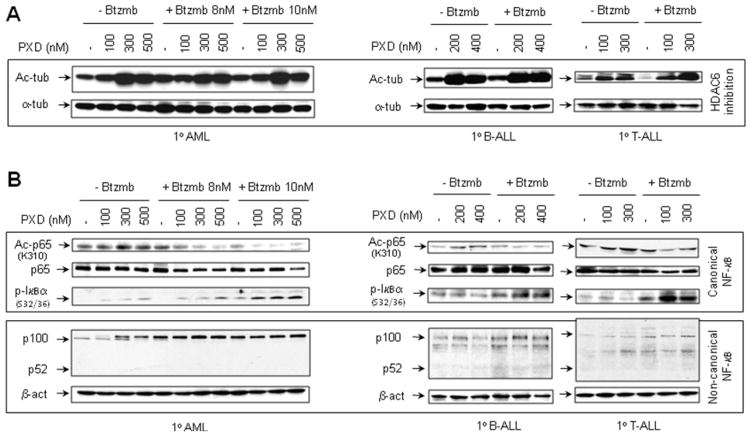
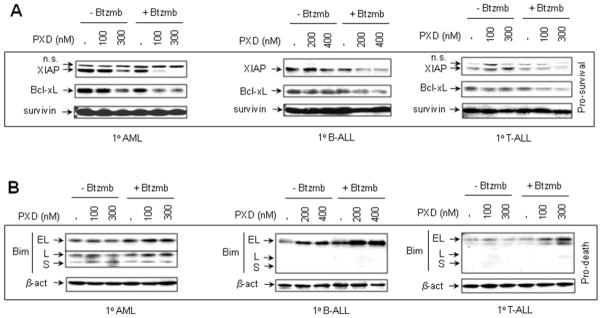
Interactions between the histone deacetylase inhibitor belinostat and the proteasome inhibitor bortezomib were investigated in acute myeloid leukaemia (AML) and acute lymphoblastic leukaemia (ALL) cells. Co-administration of sub-micromolar concentrations of belinostat with low nanomolar concentrations of bortezomib sharply increased apoptosis in both AML and ALL cell lines and primary blasts. Synergistic interactions were associated with interruption of both canonical and non-canonical nuclear factor (NF)-κB signalling pathways, e.g. accumulation of the phosphorylated (S32/S36) form of IκBα, diminished belinostat-mediated RelA/p65 hyperacetylation (K310), and reduced processing of p100 into p52. These events were accompanied by down-regulation of NF-κB-dependent pro-survival proteins (e.g. XIAP, Bcl-xL). Moreover, belinostat/bortezomib co-exposure induced up-regulation of the BH3-only pro-death protein Bim. Significantly, shRNA knock-down of Bim substantially reduced the lethality of belinostat/bortezomib regimens. Administration of belinostat ± bortezomib also induced hyperacetylation (K40) of α-tubulin, indicating histone deacetylase inhibitor 6 inhibition. Finally, in contrast to the pronounced lethality of belinostat/bortezomib toward primary leukaemia blasts, equivalent treatment was relatively non-toxic to normal CD34(+) cells. Together, these findings indicate that belinostat and bortezomib interact synergistically in both cultured and primary AML and ALL cells, and raise the possibilities that up-regulation of Bim and interference with NF-κB pathways contribute to this phenomenon. They also suggest that combined belinostat/bortezomib regimens warrant further attention in acute leukaemias.


Conflict of interest statement

Conflict-of-interest disclosure: There is no potential conflict of interest to disclose.

Figures

Figure 1
Figure 1. Bortezomib synergistically potentiates belinostat lethality in multiple AML and ALL cell lines
(A-E) Logarithmically-growing U937 (A), HL-60 (B), MV-4-11 (C), Jurkat (D), and SEM (E) cells were exposed (24 hr) to the indicated concentrations of belinostat (PXD) ± bortezomib (SEM, 3 nM; other lines, 5 nM), after which the percentage of apoptotic cells was determined by annexin V/PI staining and flow cytometry. The results represent the means ± S.D. for experiments performed in triplicate on three separate occasions. AML cell lines were exposed (24 hr) to PTL (U937 and HL-60, 5 μM and 7.5 μM; MV-4-11, 5 μM; NB4, 3 μM) ± vorinostat (V, U937, 1.5 μM; HL-60 and NB4, 1 μM; MV-4-11, 0.5μM) or LBH589 (L, U937, 15 nM; NB4, 7.5 nM; HL-60, 5 nM; MV-4-11, 3 nM). After drug treatment, apoptosis was monitored by annexin V staining and flow cytometry. (F) Median Dose Effect analysis was employed to characterize interactions between belinostat and bortezomib in U937 cells, administered over a range of concentrations at a fixed ratio (40:1) for 24 hr, reflected by apoptosis induction (annexin V staining). Combination Index (CI) values < 1.0 correspond to a synergistic interaction.
Figure 2
Figure 2. Exposure to belinostat ± bortezomib results in α-tubulin hyperacetylation, and inhibition of both canonical and non-canonical NF-κB pathways in AML and ALL cell lines
(A-C) U937, HL-60, Jurkat, and SEM cells were exposed (24 hr) to belinostat (U937, 200 nM and 300 nM; HL-60 and Jurkat, 300 nM; SEM, 100 nM) ± bortezomib (U937, 4 nM and 5 nM; HL-60 and Jurkat, 5 nM; SEM, 4 nM), after which cells were lysed and subjected to Western blot analysis to assess total and lysine 310 acetylated RelA/p65, serine 32/36 phosphorylated form of IκBα (A), total and lysine 40 acetylated α-tubulin (B), and expression of the precursor p100 and its active form p52 (C). Each lane was loaded with 30 μg of protein; blots were subsequently stripped and reprobed for expression β-actin to ensure equivalent loading and transfer of protein. Results of a representative experiment are shown; two additional studies yielded equivalent results. (D) U937 cells were stably transfected with NF-κB luciferase reporter as described in “Materials and Methods”. Cells were exposed to 200 nM or 300 nM belinostat with or without 5 nM bortezomib for 24 hr, after which cells were lysed and subjected to luciferase activity analysis. Relative luciferase activity was determined following normalization of values to total protein. NF-κB activity (reflected by RLU, relative light unit) was expressed as the fold-increase relative to values for untreated controls. (E) U937 cells were exposed to 200 nM or 300 nM belinostat in the presence or absence of 5 nM bortezomib, after which nuclear extracts were prepared and subjected to a RelA/p65-specific NF-κB-DNA binding assay as described in “Materials and Methods”. Wild-type (wt) and mutated (mt) consensus oligonucleotides were used as competitors for RelA/p65-DNA binding in order to demonstrate assay specificity. RelA/p65-DNA binding activity (reflected by relative light unit/RLU) was expressed as fold increase relative to untreated controls. For panels 2D and 2E, results represent the means ± S.D. for triplicate determinations performed on three separate occasions. Values shown represent P values for the significance of differences between cells exposed to belinostat alone versus those exposed to belinostat and bortezomib.
Figure 3
Figure 3. Treatment with belinostat ± bortezomib down-regulates NF-κB-dependent pro-survival proteins, while up-regulates the pro-death protein Bim in AML and ALL cell lines
(A-B) U937, HL-60, Jurkat, and SEM cells were exposed (24 hr) to belinostat ± bortezomib administered at the same concentrations as those described in Fig 2. Cells were then lysed and subjected to Western blot analysis to monitor expression of the anti-apoptotic proteins XIAP, Bcl-xL, and survivin (A), as well as the pro-apoptotic Bcl-2 family protein Bim, including three isoforms (BimEL, BimL, and BimS). Each lane was loaded with 30 μg of protein; blots were subsequently stripped and re-probed for expression of β-actin to ensure equivalent loading and transfer. Representative results are shown; two additional experiments yielded equivalent findings. (C) U937 and Jurkat cells were stably transfected with shRNA directed against Bim (shBim) or scrambled sequence controls (shNC). Western blot analysis demonstrates downregulation of the three Bim isoforms. Each lane was loaded with 30 μg of protein. In parallel, the same membrane was blotted for α-tubulin as a loading control. (D-E) U937 (D) and Jurkat (E) cells transfected with shBim or shNC were exposed (24 hr) to 300 nM belinostat + 5 nM bortezomib, after which cell death was monitored by annexin V/PI analysis by flow cytometry. Values shown represent the percentage of cells in the right quadrants (lower, annexin V+/PI, and upper, annexin V+/PI+). Two additional experiments yielded equivalent results.
Figure 4
Figure 4. Bortezomib increases belinostat lethality in primary AML blasts
(A-B) Primary blasts from a patient (#1) with AML (sub-type M2) were exposed (24 hr) to 100–500 nM belinostat in the presence or absence of 5 nM bortezomib, after which uptake of 7-AAD/DiOC6 (A) or annexin V/PI (B) were monitored by flow cytometry. For panel 4A, values refer to the percentage of cells in the upper (high 7-AAD uptake) or left (low DiOC6 uptake, reflecting loss of mitochondrial membrane potential or Δψm) quadrants. For panel 4B, values refer to the percentage of annexin V-positive (right quadrant) or PI-positive (upper quadrant) cells. (C) Blast samples from three additional AML patients were exposed to 300 nM belinostat ± bortezomib (#2 and #4, 5 nM; #3, 8 nM), after which 7-AAD uptake was monitored as described in panel 4A. Values represent the means ± S.D. for triplicate determinations. (D) Following treatment as described in panel C, blasts from two patients (#2 and #3) were lysed, and Western blot analysis performed to monitor PARP cleavage. CF = cleaved fragment. Each lane was loaded with 30 μg of protein; blots were subsequently stripped and re-probed for expression of β-actin to ensure equivalent loading and transfer.
Figure 5
Figure 5. Combined treatment with bortezomib and belinostat markedly induces apoptosis in primary T- and B-cell ALL cells
(A-B) Blasts from patients with B-cell ALL (A) or T-cell ALL (B) were exposed (24 hr) to the indicated concentrations of belinostat ± 5 nM bortezomib, after which uptake of 7-AAD/DiOC6 (A) or annexin V/PI (B) were determined by flow cytometry as described in Fig 4. (C) Three primary ALL (B-cell ALL = 2, and T-cell ALL = 1) samples and four cord blood (CB) CD34+ cell samples were exposed (24 hr) to belinostat (B-ALL, 400 nM; T-ALL, 300 nM; CB CD34+, 500 nM) ± 5 nM bortezomib, after which cell death (7AAD+ cells) was determined by flow cytometry as described in above. Values represent the means ± S.D. for triplicate determinations. (D) Representative photomicrographs of Wright-Giemsa stained cytospin slides for primary B- and one T-cell ALL specimens viewed under oil at 60x magnification. (E) Following treatment as described in panel 5A and 5B, blasts from B-cell and T-cell ALL patients were lysed, and Western blot analysis performed to monitor PARP cleavage. Each lane was loaded with 30 μg of protein; blots were subsequently stripped and re-probed for expression of β-actin to ensure equivalent loading and transfer. (F) Normal cord blood (CB) CD34+ cells were exposed to 500 nM belinostat ± 5 nM bortezomib, after which annexin V/PI uptake was monitored as in panel 5B.
Figure 6
Figure 6. Co-exposure to belinostat and bortezomib induces α-tubulin hyperacetylation, and interrupts both canonical and non-canonical NF-κB signaling in primary AML and ALL blasts
(A-B) Blasts from patients with AML, B-cell ALL, or T-cell ALL were exposed (24 hr) to belinostat (AML, 100, 300 and 500 nM; B-ALL, 200 and 400 nM; T-ALL, 100 and 300 nM) ± bortezomib (AML, 8 and 10nM; B-ALL and T-ALL, 5 nM), after which cells were lysed and subjected to Western blot analysis to assess acetylation of α-tubulin (lysine 40, A) and RelA/p65 (lysine 310), phosphorylation of IκBα (serine 32/36), and processing of p100 to p52 (B). Levels of total p65 and α-tubulin are shown as controls. Each lane was loaded with 30 μg of protein; blots were subsequently stripped and reprobed for β-actin to ensure equivalent loading and transfer of protein. Duplicate experiments yielded equivalent results.
Figure 7
Figure 7. Co-treatment with belinostat and bortezomib leads to down-regulation of NF-κB-dependent proteins XIAP and Bcl-xL, accompanied by up-regulation of Bim in primary AML and ALL blasts
(A-B) Primary AML, B-ALL, and T-ALL blasts were treated (24 hr) with the indicated concentrations of belinostat ± bortezomib (AML, 8 nM; B-ALL and T-ALL, 5 nM) as described in Fig 6. Following treatment, Western blot analysis was performed to monitor expression levels of the pro-apoptotic proteins XIAP, Bcl-xL, and survivin, as well as the proapoptotic protein Bim (BimEL, BimL, and BimS). Each lane was loaded with 30 μg of protein; blots were subsequently stripped and re-probed for expression of β-actin to ensure equivalent loading and transfer. Duplicate experiments yielded equivalent results.

References

    1. Bolden JE, Peart MJ, Johnstone RW. Anticancer activities of histone deacetylase inhibitors. Nat Rev Drug Discov. 2006;5(9):769–784. - PubMed
    1. Ungerstedt JS, Sowa Y, Xu WS, et al. Role of thioredoxin in the response of normal and transformed cells to histone deacetylase inhibitors. Proc Natl Acad Sci U S A. 2005;102(3):673–678. - PMC - PubMed
    1. Haggarty SJ, Koeller KM, Wong JC, Grozinger CM, Schreiber SL. Domain-selective small-molecule inhibitor of histone deacetylase 6 (HDAC6)-mediated tubulin deacetylation. Proc Natl Acad Sci U S A. 2003;100(8):4389–4394. - PMC - PubMed
    1. Drummond DC, Noble CO, Kirpotin DB, Guo Z, Scott GK, Benz CC. Clinical development of histone deacetylase inhibitors as anticancer agents. Annu Rev Pharmacol Toxicol. 2005;45:495–528. - PubMed
    1. Grant S, Easley C, Kirkpatrick P. Vorinostat. Nature Review Drug Discovery. 2007;6:1–2. - PubMed

Publication types

MeSH terms

Substances