. 2011 Apr;24(2):352-60.
doi: 10.1111/j.1755-148X.2011.00828.x. Epub 2011 Feb 18.

DNA-methylation profiling distinguishes malignant melanomas from benign nevi

Affiliations
Free PMC article

DNA-methylation profiling distinguishes malignant melanomas from benign nevi

Kathleen Conway et al. Pigment Cell Melanoma Res. 2011 Apr.
Free PMC article

Abstract

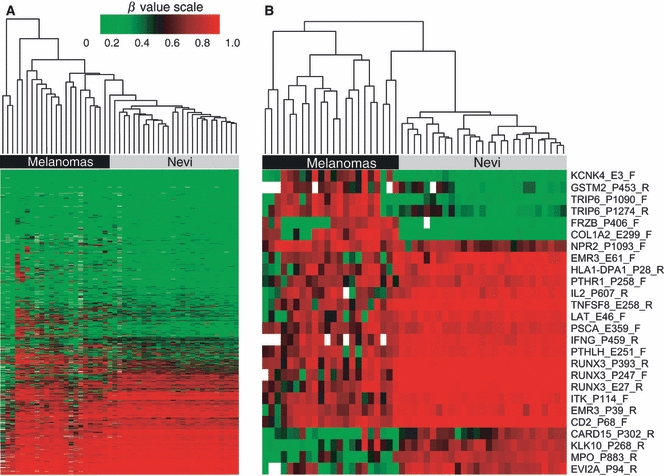
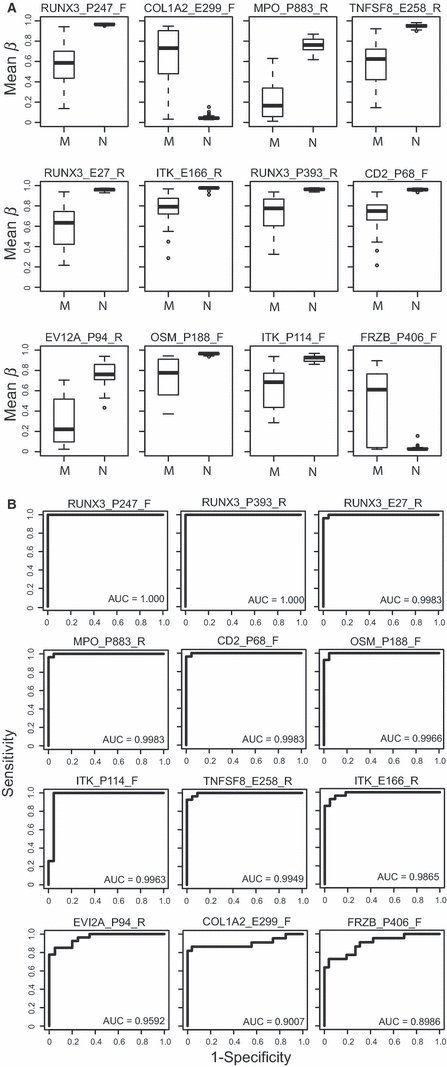
DNA methylation, an epigenetic alteration typically occurring early in cancer development, could aid in the molecular diagnosis of melanoma. We determined technical feasibility for high-throughput DNA-methylation array-based profiling using formalin-fixed paraffin-embedded tissues for selection of candidate DNA-methylation differences between melanomas and nevi. Promoter methylation was evaluated in 27 common benign nevi and 22 primary invasive melanomas using a 1505 CpG site microarray. Unsupervised hierarchical clustering distinguished melanomas from nevi; 26 CpG sites in 22 genes were identified with significantly different methylation levels between melanomas and nevi after adjustment for age, sex, and multiple comparisons and with β-value differences of ≥ 0.2. Prediction analysis for microarrays identified 12 CpG loci that were highly predictive of melanoma, with area under the receiver operating characteristic curves of > 0.95. Of our panel of 22 genes, 14 were statistically significant in an independent sample set of 29 nevi (including dysplastic nevi) and 25 primary invasive melanomas after adjustment for age, sex, and multiple comparisons. This first report of a DNA-methylation signature discriminating melanomas from nevi indicates that DNA methylation appears promising as an additional tool for enhancing melanoma diagnosis.


Figures

Figure 1
Figure 1
Hierarchical clustering of methylation β-values using the Illumina GoldenGate Cancer Panel I array in FFPE nevi and melanomas from sample set #1. DNA-methylation profiles for 22 melanomas and 27 nevi are shown. Columns represent tissue samples; rows represent CpG loci. Methylation level (β) from 0 (green/unmethylated) to 1 (red/highly methylated). Missing values are shown in white. (A) Unsupervised clustering based on 988 CpG sites in 646 genes after filtering (see Methods); probes included autosomal loci and those with a detection P-value of <0.05. (B) Clusters based on the 26 CpG sites showing significantly different methylation β levels between nevi and melanomas after adjustment for age and sex and Bonferroni correction for multiple comparisons. The upper portion of the heatmap shows seven CpG loci in six genes exhibiting hypermethylation, and the lower portion shows 19 CpG loci in 16 genes exhibiting hypomethylation in melanomas compared with nevi.
Figure 2
Figure 2
CpG loci that predict melanoma identified by PAM analysis in sample set #1. (A) Box plots of methylation β levels in the 12 CpG loci identified by PAM analysis as being predictive of melanoma. CpG loci shown differed by ≥0.2 mean β between melanomas (M) and nevi (N), except for ITK_P114_F. Each box plot shows the median β-value (dark bar within box), the interquartile range (IQR = Q3−Q1) (outer boundaries of box). The whiskers (broken line) cover (Q1−1.5IQR, Q3 + 1.5IQR). Additional information on mean β-values for nevi and melanomas, differences in mean β-values, and P-values adjusted for age, sex, and multiple comparisons using Bonferroni correction are given in Table 1. (B) ROC curves showing the sensitivity versus 1-specificity of the 12 CpG loci identified by PAM that predict melanoma. Sensitivity, the true positive rate, is shown along the y-axis, while 1-specificity, or the false positive rate, is shown along the x-axis. The calculated AUC is given for each plot in rank order beginning with highest AUC.

References

    1. ACS . American Cancer Society, Cancer Facts and Figures, 2010. Atlanta: American Cancer Society; 2010.
    1. Andreotti AH, Schwartzberg PL, Joseph RE, Berg LJ. T-cell signaling regulated by the Tec family kinase, Itk. Cold Spring Harb. Perspect. Biol. 2010;2 Epub 2010 Jun 2. - PMC - PubMed
    1. Anichini A, Vegetti C, Mortarini R. The paradox of T-cell-mediated antitumor immunity in spite of poor clinical outcome in human melanoma. Cancer Immunol. Immunother. 2004;53:855–864. - PMC - PubMed
    1. Antequera F, Bird A. CpG islands. EXS. 1993;64:169–185. - PubMed
    1. Arnhold J, Flemmig J. Human myeloperoxidase in innate and acquired immunity. Arch. Biochem. Biophys. 2010;500:92–106. - PubMed

Publication types

Substances