

Bifidobacterium population analysis in the infant gut by direct mapping of genomic hybridization patterns: potential for monitoring temporal development and effects of dietary regimens
- PMID: 21375714
- PMCID: PMC3818999
- DOI: 10.1111/j.1751-7915.2010.00216.x
Bifidobacterium population analysis in the infant gut by direct mapping of genomic hybridization patterns: potential for monitoring temporal development and effects of dietary regimens
Abstract
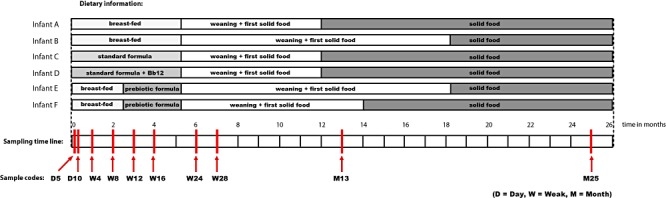
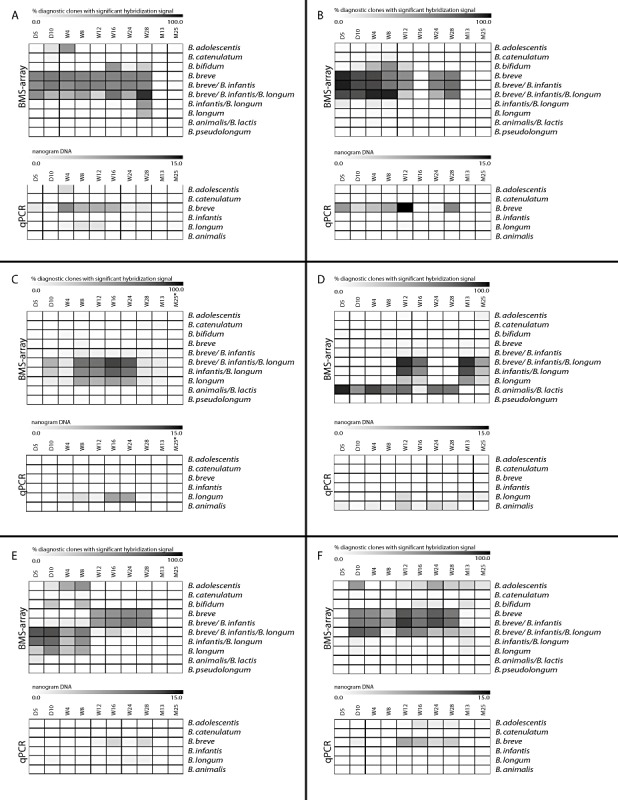
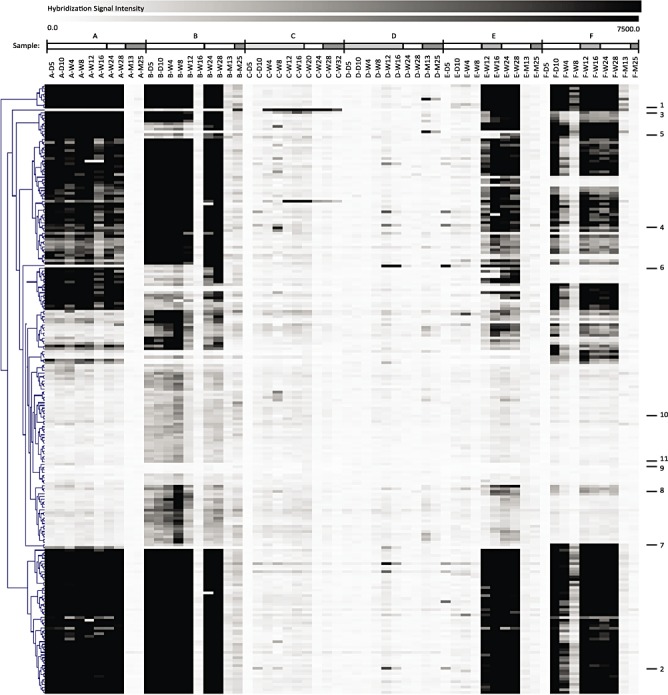
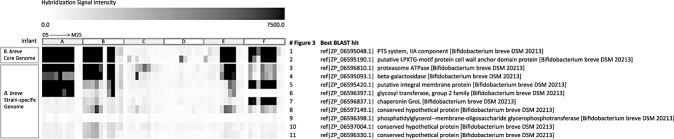
A bifidobacterial mixed-species microarray platform was used in a proof-of-principle study to address the composition and development of bifidobacteria in DNA extracted from faecal samples. These were collected in a time-course of 2 years since birth and derived from human infants that were breastfed, standard formula-fed or received a prebiotic formula during their weaning period. A set of over 50 samples was analysed, testifying for the throughput of the designed platform for multiple genome hybridizations. The generated data revealed that faecal samples of breastfed infants contained a high abundance of genomic DNA homologous to Bifidobacterium breve. In contrast, faecal samples from standard formula-fed infants lacked detectable amounts of this B. breve DNA but contained genes with high similarity to B. longum. Remarkably, infants that received breastmilk and later a prebiotic formula consisting of a standard formula milk containing a mixture of specific galacto- and fructo-oligosaccharides, continued to harbour a B. breve-dominant faecal population. One infant that received standard formula in combination with the additional B. lactis Bb12 culture, contained significant amounts of faecal DNA belonging to Bb12 but only during the period of ingestion. The microarray platform showed sufficient sensitivity to analyse the B. breve group at the strain level. Overall, the B. breve populations observed in the faecal samples of the studied infants showed a stable composition over time and were unique per infant. In conclusion, our results show the applicability of comparative genome hybridization to study bifidobacterial populations in infant faecal samples without the use of any amplification step.
© 2010 The Authors. Journal compilation © 2010 Society for Applied Microbiology and Blackwell Publishing Ltd.
Figures
References
-
- Akopyants N.S., Clifton S.W., Martin J., Pape D., Wylie T., Li L. A survey of the Leishmania major Friedlin strain V1 genome by shotgun sequencing: a resource for DNA microarrays and expression profiling. Mol Biochem Parasitol. 2001;113:337–340. et al. - PubMed
Publication types
MeSH terms
LinkOut - more resources
Full Text Sources
Medical
Molecular Biology Databases
