. 2011 Jun;229(2):308-23.
doi: 10.1016/j.expneurol.2011.02.014. Epub 2011 Mar 1.

The generation of olfactory epithelial neurospheres in vitro predicts engraftment capacity following transplantation in vivo

Affiliations

The generation of olfactory epithelial neurospheres in vitro predicts engraftment capacity following transplantation in vivo

Richard C Krolewski et al. Exp Neurol. 2011 Jun.

Abstract

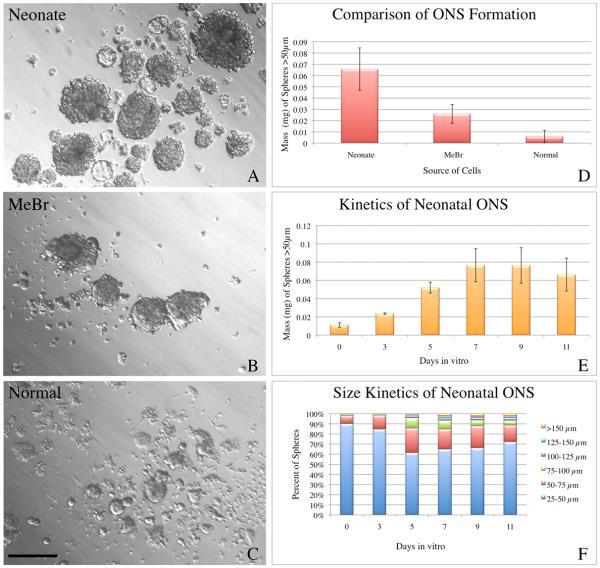
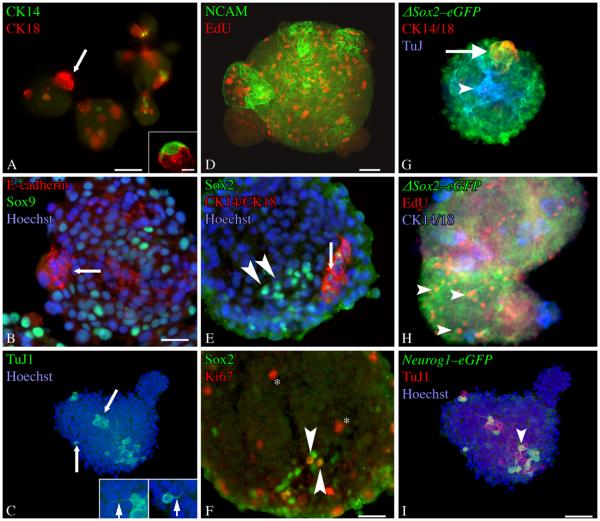
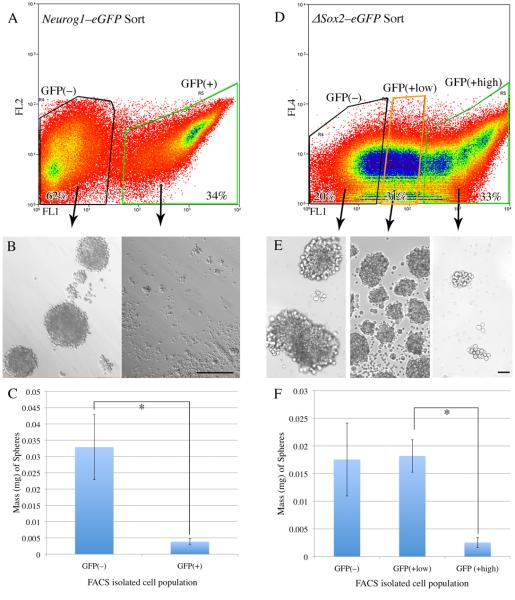
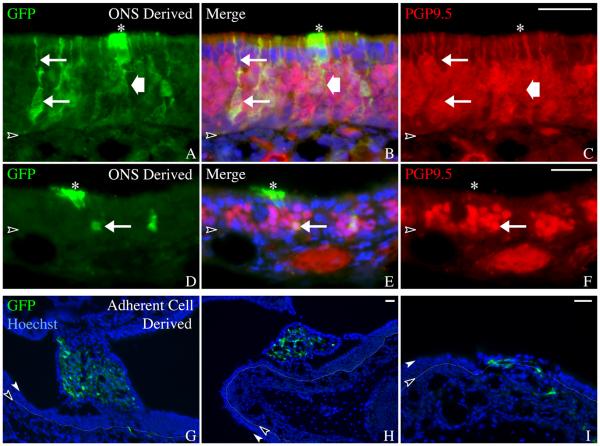
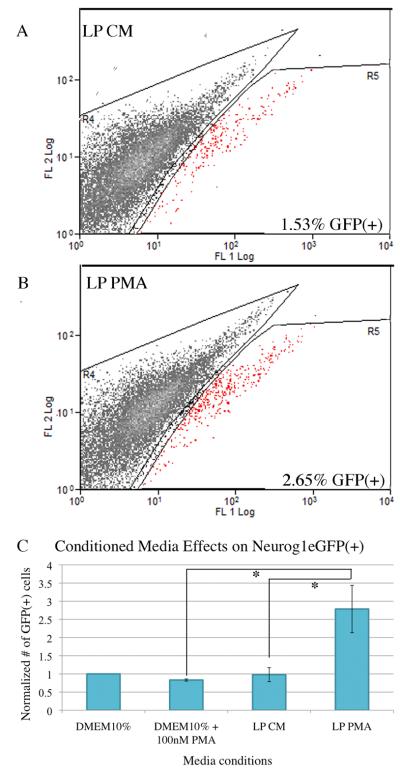
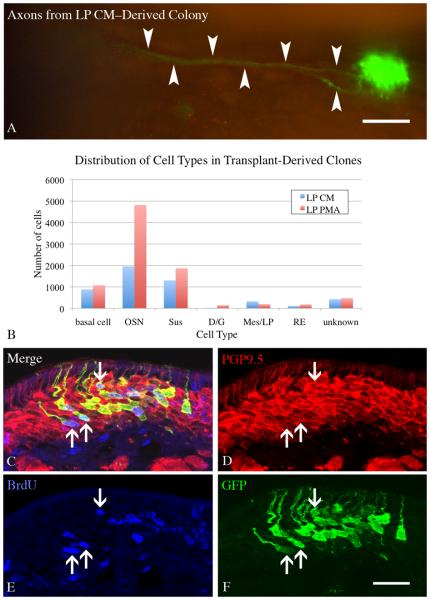
The stem and progenitor cells of the olfactory epithelium maintain the tissue throughout life and effectuate epithelial reconstitution after injury. We have utilized free-floating olfactory neurosphere cultures to study factors influencing proliferation, differentiation, and transplantation potency of sphere-grown cells as a first step toward using them for therapeutic purposes. Olfactory neurospheres form best and expand most when grown from neonatal epithelium, although methyl bromide-injured or normal adult material is weakly spherogenic. The spheres contain the full range of epithelial cell types as marked by cytokeratins, neuron-specific antigens, E-cadherin, Sox2, and Sox9. Globose basal cells are also prominent constituents. Medium conditioned by growth of phorbol ester-stimulated, immortalized lamina propria-derived cells (LP(Imm)) significantly increases the percentage of Neurog1eGFP(+) progenitors and immature neurons in spheres. Sphere-forming capacity resides within selected populations; FACS-purified, Neurog1eGFP(+) cells were poorly spherogenic, while preparations from ΔSox2eGFP transgenic mice that are enriched for Sox2(+) basal cells formed spheres very efficiently. Finally, we compared the potency following transplantation of cells grown in spheres vs. cells derived from adherent cultures. The sphere-derived cells engrafted and produced colonies with multiple cell types that incorporated into and resembled host epithelium; cells from adherent cultures did not. Furthermore, cells from spheres grown in conditioned media from the phorbol ester-activated LP(Imm) line gave rise to significantly more neurons after transplantation as compared with control. The current findings demonstrate that sphere formation serves as a biomarker for engraftment capacity and multipotency of olfactory progenitors, which are requirements for their eventual translational use.


Figures

Figure 1
Figure 1. Neonatal olfactory mucosa forms spheres most efficiently
A-C) ONS were generated from three different source tissues: neonates (A), adult animals 2 days after methyl bromide lesion (B), and normal adult animals (C). All three conditions result in detectable sphere formation as seen by representative bright field images (A-C). D) At 7 DIV, plots of the average mass ± SEM demonstrate that ONS derived from neonates are most spherogenic, followed by ONS derived from MeBr–lesioned adults. Normal epithelium produces very few ONS. ANOVA indicates significant variation across conditions (F = 9.167, p = 0.0085) and a Tukey–Kramer Multiple Comparisons Test indicates that neonatal ONS were significantly different from normal adult ONS (q = 5.777, p < 0.01). E) Neonatal ONS undergo rapid expansion early in vitro and mass expansion plateaus around 7–9 DIV. Parallel aliquots of cells were established and mass ± SEM was measured at the indicated time points to establish a growth curve for neonatal ONS. F) The percent of ONS in progressively larger size bins was plotted as a function of time in vitro. The data show that ONS increase in size and the size distribution changes over the culture period. Scale bar in C is 100 μm and applies to A–C.
Figure 2
Figure 2. Olfactory neurospheres express cell-type specific markers characteristic of intact olfactory epithelium
ONS were stained as whole mounts (A-D) or cryosectioned and stained as described (E–F). A) Occasional CK14(+) cells can be found in ONS, but they appear with less frequency than any other differentiated cell type examined. Some of the CK14(+) cells have morphologies highly reminiscent of the in vivo HBC counterparts (inset). CK18(+) cells are also present in the spheres and are distinct from CK14(+) cells. These often occur in subdomains that appear as “buds” of morphologically homogeneous cells (arrow). B) Staining for E-cadherin, a marker of sus and Bowman's Duct and Gland structures in vivo, also labels these subdomains (arrow). Numerous Sox9(+) cells, a marker of Bowman's Duct and Gland cells in the OE, are present in ONSs. C) TuJ-1(+) cells are found throughout ONSs. Often, these cells have processes (arrows–shown at higher power in insets) that resemble axons (left inset) or apical dendrites (right inset). D) NCAM(+) also labels a neuronal population present in ONS. EdU(+) cells indicate that DNA synthesis is actively occuring in the ONSs. E) Sox2(+)/CK14(−)/CK18(−) cells (arrowheads) and Sox2(+)/CK14(+)/CK18(+) cells (arrow) are found in ONSs. F) A number of Sox2(+) cells are Ki67(+) (arrowheads). Additional cells in the ONSs are also Ki67(+) (asterisk). G, H) ONSs derived from ΔSox2eGFP neonates The vast majority of cells in the spheres are GFP(+). These include both cytokeratin 14/18(+) cells (arrow) found in subdomains and TuJ-1(+) cells stretching throughout the ONS (arrowhead). H) Many of the GFP(+) cells are also EdU(+) and cytokeratin 14/18 (−) (arrowheads). These criteria define GBCs in vivo and indicate their presence in ONSs. Separate CK14 and CK18 antibodies were visualized with secondary antibodies conjugated to the same flourophore to allow for detection of additional antigens (TuJ in G, EdU in H). I) ONSs derived from Neurog1eGFP neonates. A number of cells in the spheres are GFP(+) and many of these are TuJ1 (+) and/or PGP9.5(+) (arrowheads). Scale bar in A is 50 μm. Scale bar in the inset of A is 10 μm. Scale bar in B is 25 μm and applies to B and E. Scale bar in D is 50 μm and applies to C and D. Scale bar in F is 25 μm. Scale bar in I is 50 μm and applies to G and H.
Figure 3
Figure 3. Neurog1eGFP(+) cells do not form olfactory neurospheres, while a subset of ΔSox2eGFP(+) cells do
A) Neurog1eGFP neonatal OE was dissociated and sorted into GFP(−) and GFP(+) fractions (62% and 34% of cells, respectively). Cells were gated on forward scatter/side scatter and pulse width to restrict the sort to single cells. Cells were also gated as propidium iodide negative (PI[−]) indicating viability. The cells were then cultured under ONS–forming conditions. B) Brightfield examination of the two different sorted populations from Neurog1eGFP neonates at 7 DIV demonstrates ONS formation in the GFP(−) population and negligible ONS formation in the GFP(+) population. C) Quantitative analysis of the two different Neurog1eGFP sorted populations at 7 DIV indicates that the mass of spheres formed by the GFP(−) population is more than four–fold greater than the mass derived from the GFP(+) population (p = 0.0313, Wilcoxon matched–pairs signed–ranks test). D) ΔSox2eGFP neonatal OE was dissociated and sorted into GFP(no), GFP(low), and GFP(high) populations (20%, 31%, and 33% of PI(−) cells, respectively). E) Brightfield examination of the cultures from the three different sorted populations at 7 DIV demonstrates robust ONS formation in the GFP(low) and GFP(no) populations, but poor ONS formation in the GFP(high) population. F) Quantitative analysis of sphere formation from the three different ΔSox2eGFP sorted populations at 7 DIV indicates that the mass of spheres from the GFP(low) population is approximately four-fold greater than the mass of the GFP(high) population (Kruskal-Wallis, KW = 7.848, p= 0.0009, Dunn's multiple comparisons test for GFP(high) vs. GFP(low), p < 0.05).
Figure 4
Figure 4. ONS-derived cells engraft appropriately into the lesioned recovering epithelium
Cells derived from 8 DIV ONS were compared to cells derived from 8 DIV adherent cultures in a transplantation assay that tests engraftment capacity. A, B) 2 weeks after transplantation, cells derived from ONS cultures formed primarily smaller colonies that have incorporated and integrated into the regenerating epithelium (asterisks). C, D) In contrast, cells derived from adherent cultures formed primarily large, sprawling colonies (arrows) that have not incorporated into the OE of methyl bromide-lesioned host animals. The colonies appear to sit above the epithelium or bridge adjacent areas of epithelium via synechiae. E) Inset of boxed region in A shows more detailed morphology of an ONS–derived colony. The GFP(+) cells intercalate extensively with host cells as seen by the punctate GFP signal intermixed with GFP(−) host cells, suggesting appropriate incorporation into the epithelium. F) Inset of boxed region in C shows more detailed morphology of an adherent culture–derived colony. The GFP(+) cells do not intercalate extensively with host cells. G) Engrafted colonies from three host animals for each transplant condition were classified into three categories: (1) incorporated (resembling the colonies identified by asterisks) – depicted in yellow; (2) not incorporated (resembling the colonies identified by arrows) – depicted in blue; or (3) undefined (unable to definitively classify) – depicted in plum. The graph clearly shows that colonies resulting from ONS-derived cells result in a higher percentage of incorporated colonies. Yates Chi-square analysis of the raw data indicates a significant difference between the two conditions (Yates Chi-square = 36.999, Yates p-value = 1 × 10⁻⁸ ).
Figure 5
Figure 5. ONS-derived colonies contain cell types that resemble adjacent host OE
A-F) Coronal sections of ONS-derived colonies confirm whole mount observations that the sphere-derived cells intergrate into the regenerating epithelium. Neurons (arrows) and sustentacular cells (asterisks) are identified based on morphology and immunostaining. GFP(+)/PGP9.5(+) neurons with an apical dendrite (upper arrow in A-C) are seen in the transplant-derived colonies. Transplant-derived sustentacular cells (asterisks) are identified as GFP(+)/PGP9.5(−) cells with apically positioned nuclei and footprocesses extending toward the basal lamina (wide arrow). Scale bar in C is 25 μm and applies to A-C. Scale bar in F is 25 μm and applies to D-F. G-I) Coronal sections of adherent culture–derived colonies confirm whole mount observations that these cells do not incorporate appropriately into regenerating epithelium. Endogenous GFP was compared with Hoechst labeling of all nuclei. The colonies resulting from adherent culture–derived cells appear spindle-shaped and mesenchymal and thus, are distinct morphologically from the normal differentiated cell types found in the OE. The basal lamina is designated by a black arrowhead and thin dotted line, the apical surface of the epithelium is designated by a white arrowhead. Scale bar in H is 25 μm and applies to G. Scale bar in I is 25 μm.
Figure 6
Figure 6. Culturing in LP PMA media increases the percentage of GFP(+) cells in ONS derived from Neurog1eGFP neonates
Cells derived from Neurog1eGFP neonates and cultured as ONS for 7 DIV show increased GFP(+) cells after culture in conditioned media from phorbol ester-treated LPImm cells (LP PMA). Dissociated ONS at 7 DIV were assayed for the percentage of GFP(+) cells by flow cytometry. A, B) Representative FACS profiles of dissociated cells from ONS cultured in control conditioned media (LP CM, panel A) and LP PMA (panel B). ONS cultured in LP PMA consistently and reproducibly showed an increased percentage of GFP(+) cells by flow cytometry. GFP(+) cells are depicted as red spots on the FACS profiles. Both profiles were equivalently gated for single cells and exclusion of propidium iodide. C) The number of GFP(+) cells from base media (DMEM10%), base media treated with phorbol ester (DMEM10% + 100 nM PMA), conditioned media from LPImm cells (LP CM), and conditioned media from phorbol ester treated (100 nM) LPImm cells (LP PMA) were normalized to base media for each replicate and the average normalized number of GFP(+) cells was plotted for each condition. Raw percentage values for each group varied significantly across the conditions (repeated measures ANOVA, F = 4.153, p = 0.0014) and LP PMA was significantly different from LP CM and DMEM10% + 100 nM PMA by Tukey-Kramer post tests (q = 5.474, p < 0.05; q = 5.963, p < 0.001, respectively).
Figure 7
Figure 7. Colonies derived from spheres cultured in LP PMA have an increased number of neurons
ONS derived from constitutively expressing GFP donor neonates were cultured in LP CM or LP PMA for 8 DIV, then dissociated and transplanted into 1 day post methyl bromide-lesioned host animals. Animals were sacrificed 2 weeks after transplantation and screened for GFP(+) donor-derived colonies. A) Large colonies were seen in both conditions (LP CM shown here), with some having visible axons projecting back towards the olfactory bulb (arrow). Scale bar is 100 μm. B) All colonies from LP CM and LP PMA hosts (n=3 per condition), were counted and the cell types present were documented. Chi–square analysis indicates that the two distributions are significantly different from one another (Chi–square = 681, p < 0.0001) and neurons significantly contribute to this difference (Chi–square = 459.9, p < 0.001). C-F) A cohort of host mice were pulsed with 30 mg/kg BrdU 8 days after transplantation to label cells in S-phase and then allowed to survive for an additional 6 days (the chase phase) before fixation. Many neurons arise in vivo from transplant-derived cells (arrows) as shown by co-labeling with GFP to identify donor–derived cells, PGP9.5 to identify neurons, and BrdU to identify cells labeled during the pulse. Scale bar in F is 25 μm applies to C-F.

Similar articles

Cited by

References

    1. Amos S, Martin PM, Polar GA, Parsons SJ, Hussaini IM. Phorbol 12-myristate 13-acetate induces epidermal growth factor receptor transactivation via protein kinase Cdelta/c-Src pathways in glioblastoma cells. J Biol Chem. 2005;280:7729–7738. - PMC - PubMed
    1. Barraud P, He X, Zhao C, Ibanez C, Raha-Chowdhury R, Caldwell MA, Franklin RJ. Contrasting effects of basic fibroblast growth factor and epidermal growth factor on mouse neonatal olfactory mucosa cells. Eur J Neurosci. 2007;26:3345–3357. - PubMed
    1. Carter LA, MacDonald JL, Roskams AJ. Olfactory horizontal basal cells demonstrate a conserved multipotent progenitor phenotype. J Neurosci. 2004;24:5670–5683. - PMC - PubMed
    1. Chen X, Fang H, Schwob JE. Multipotency of purified, transplanted globose basal cells in olfactory epithelium. J Comp Neurol. 2004;469:457–474. - PubMed
    1. Dammann CE, Nielsen HC, Carraway KL., 3rd Role of neuregulin-1 beta in the developing lung. Am J Respir Crit Care Med. 2003;167:1711–1716. - PubMed

Publication types