Review
. 2011 Nov 30;105(1):14-26.
doi: 10.1016/j.physbeh.2011.02.030. Epub 2011 Mar 2.

The functional role of the T1R family of receptors in sweet taste and feeding

Affiliations
Review

The functional role of the T1R family of receptors in sweet taste and feeding

Yada Treesukosol et al. Physiol Behav. .

Abstract

The discovery of the T1R family of Class C G protein-coupled receptors in the peripheral gustatory system a decade ago has been a tremendous advance for taste research, and its conceptual reach has extended to other organ systems. There are three proteins in the family, T1R1, T1R2, and T1R3, encoded by their respective genes, Tas1r1, Tas1r2, and Tas1r3. T1R2 combines with T1R3 to form a heterodimer that binds with sugars and other sweeteners. T1R3 also combines with T1R1 to form a heterodimer that binds with l-amino acids. These proteins are expressed not only in taste bud cells, but one or more of these T1Rs have also been identified in the nasal epithelium, gut, pancreas, liver, kidney, testes and brain in various mammalian species. Here we review current perspectives regarding the functional role of these receptors, concentrating on sweet taste and feeding. We also discuss behavioral findings suggesting that a glucose polymer mixture, Polycose, which rodents avidly prefer, appears to activate a receptor that does not depend on the combined expression of T1R2 and T1R3. In addition, although the T1Rs have been implicated as playing a role in glucose sensing, T1R2 knock-out (KO) and T1R3 KO mice display normal chow and fluid intake as well as normal body weight compared with same-sex littermate wild type (WT) controls. Moreover, regardless of whether they are fasted or not, these KO mice do not differ from their WT counterparts in their Polycose intake across a broad range of concentrations in 30-minute intake tests. The functional implications of these results and those in the literature are considered.


Figures

Figure 1
Figure 1
Licks (adjusted for water) to Polycose (top row), sucrose (middle row) and Nasaccharin (bottom row) for individual T1R3 KO mice (open circles) and mean ± SE (bold plot) for each stimulus. Animals were tested partially food and water restricted (1 g chow, 2 ml water 23 h before the test session) with a series of concentrations from a single compound on Monday, Wednesday and Friday for Week 1, and then were tested with the next compound on Week 2, and then with the last compound on Week 3. The order of presentation for compounds across weeks within each group was determined by a Latin Square. The trials were 5 s in duration and sessions were 25 min. Only animals that initiated at least 2 trials per concentration were included in the concentration-response analysis. Each row indicates the test stimulus and each column indicates the response of the subgroup that was tested with that stimulus in weeks 1, 2, and 3 respectively. The order of stimulus presentation for a given subgroup is presented above each graph (PO = Polycose; SA = Na-saccharin; SU = sucrose). All KO mice responded in a concentration dependent manner to Polycose and displayed virtually flat responses to Nasaccharin regardless of order of presentation. When sucrose was presented as the first or second test stimulus, KO mice did not generally show concentration-dependent responses, but some degree of concentration-dependent licking to sucrose was observed in KO mice presented sucrose in the third week after Polycose exposure in the first week. This experience-dependent increase in sucrose responsiveness is thought to be based on learning (see text and Figure 3). A similar series of results were obtained for T1R2 KO mice (not shown). Reprinted from Treesukosol et al. [111] with permission from the American Physiological Society.
Figure 2
Figure 2
Licks (adjusted for water) to Polycose (top row), sucrose (middle row) and Nasaccharin (bottom row) for individual WT littermate controls of T1R3 KO mice (open circles) and mean ± SE (bold plot) for each stimulus. See Figure 1 caption for details of testing and analysis. Regardless of testing order, all WT mice showed concentration-dependent licking responses to Polycose, sucrose and Na-saccharin. A similar series of results was obtained for T1R2 WT littermate controls (not shown). Reprinted from Treesukosol et al. [111] with permission from the American Physiological Society.
Figure 3
Figure 3
Hypothesis for why concentration-dependent licking of sucrose was observed in some KO mice tested (Week 3) after prior Polycose exposure (Week 1). Animals could potentially associate cues such as taste, viscosity, and smell of Polycose with the positive nutritive consequences of its ingestion. In this sense, these cues become conditioned stimuli (CS). It is thus possible that sucrose shares some of these cues such as viscosity and smell (dashed box). Consequently, the concentration-dependent licking of sucrose in Week 3 in mice that had prior experience with Polycose testing (Week 1) could be attributed to a conditioned response rather than to the unconditioned hedonic characteristics of the stimulus (see text for more elaboration).
Figure 4
Figure 4
Correlation between taste detection thresholds of individual mice from 4 different strains: C57BL/6J (B6, circles), SWR/J (SWR, triangles); 129P3/J (129, squares); DBA/2J (DBA, diamonds) for sucrose vs. glucose (a), sucrose vs. glycine (b) and glucose vs. glycine (c). The B6 and SWR strains (so called “taster” strains) possess an allelic form of Tasr3 that has been shown to be responsible for the relatively greater preferences of these mice for low concentrations of many sweeteners compared with mice from the 129 and D2 strains (so called “non-taster” strains) which possess a different allele. The effect of the allelic variation could be seen in the ability of the mice to detect sucrose and glucose in a psychophysical task. As would be predicted, sucrose thresholds correlated highly with glucose thresholds. However, glycine thresholds did not correlate as well with those for the two sugars presumably because this amino acid binds with both the T1R2+3 and T1R1+3 heterodimers and activation of the latter is not affected by this particular allelic variation of Tas1r3. Reprinted from Eylam and Spector [23] with permission from Oxford University Press
Figure 5
Figure 5
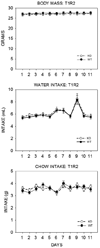
Mean ±SE body weight (top), daily water (middle) and chow (Purina Laboratory Chow 5001, St. Louis, MO) (bottom) intake of adult T1R2 KO mice (open symbols) and their same-sex WT littermate controls (closed symbols) for 11 days. The mice were housed individually in polycarbonate tub cages under a 12 h/12 h light/dark cycle in a room that had temperature and humidity automatically controlled. Each genotype group consisted of 12 males and 8 females. These mice had been previously tested in brief access tests with sugars, Na-saccharin, and Polycose. The mean age of the mice in each group was 29.3 ± 0.47 weeks. In a three-way ANOVA (genotype × sex × day) there was no significant main effect of genotype (F(1,36)=0.826, p=0.369) and no significant genotype × sex (F(1,36)=0.992, p=0.326), genotype × day (F(10,360)=0.780, p=0.648), or genotype × sex × day (F(10,360)=0.527, p=0.871) interactions for body weight; no significant main effect of genotype (F(1,36)=0.188, p=0.667) and no significant genotype × sex (F(1,36)=0.136, p=0.714), genotype × day (F(10,360)=0.112, p=1.000), or genotype × sex × day (F(10,360)=0.488, p=0.898) interactions for water intake; no significant main effect of genotype (F(1,36)=0.012, p=0.913) and no significant genotype × sex (F(1,36)=0.109, p=0.743), genotype × day (F(10,360)=1.379, p=0.188), or genotype × sex × day (F(10,360)=0.366, p=0.961) interactions for food intake. The perturbation in water intake on Day 9 is unexplained but when this data point was excluded, the statistical outcomes reported remained the same.
Figure 6
Figure 6
Mean ±SE body weight (top) and daily water (middle) and chow (Purina Laboratory Chow 5001, St. Louis, MO) (bottom) intake of adult T1R3 KO mice (open symbols) and their same-sex WT littermate controls (control symbols) for 11 days. The mice were housed individually in polycarbonate tub cages under a 12/12 light/dark cycle in a room that had temperature and humidity automatically controlled. Each genotype group consisted of 12 males and 8 females. These mice had been previously tested in brief access tests with sugars, Nasaccharin, and Polycose. The mean age of the mice in each group was 21.8 ± 0.73 weeks. The T1R2 groups were significantly older than the T1R3 groups in this study (F(1,72)=68.434, p<0.001). This likely accounted for the significant difference in body weight found between the T1R2 and T1R3 groups (F(1,72)=34.458, p<0.001). In a three-way ANOVA (genotype × sex × day) there was no significant main effect of genotype (F(1,36)=0.711, p=0.405) and no significant genotype × sex (F(1,36)=0.038, p=0.847), genotype × day (F(10,360)=0.862, p=0.569), or genotype × sex × day (F(10,360)=0.651, p=0.769) interactions for body weight; there was no significant main effect of genotype (F(1,36)=0.164, p=0.688) and no significant genotype × sex (F(1,36)=0.000, p=0.987), genotype × day (F(10,360)=0.479, p=0.903), or genotype × sex × day (F(10,360)=0.416, p=0.939) interactions for water intake; there was no significant main effect of genotype (F(1,36)=0.022, p=0.883) and no significant genotype × sex (F(1,36)=0.734, p=0.397), genotype × day (F(10,360)=0.341, p=0.969), or genotype × sex × day (F(10,360)=0.764, p=0.663) interactions for food intake. The perturbation in water intake on Day 9 is unexplained but when this data point was excluded, the statistical outcomes reported remained the same.
Figure 7
Figure 7
Mean ±SE total licks of Polycose as a function of concentration and fasting state by T1R2 (left panel) and T1R3 (right panel) KO mice (open symbols) and their WT littermate controls (closed symbols) in 30-min intake tests in a Davis Rig lickometer with a stationary drinking spout. The mean age of the mice at the start of testing for each T1R2 genotype (n=8) was 44.9 ± 1.48 weeks and for each T1R3 genotype (n=9) was 33.4 ± 0.69 weeks. Licking as opposed to intake was measured to avoid inaccuracies in volume measurement due to spillage, and it was assumed that the lick volumes were not different across the genotypes. The animals were tested after 23.5 h of food deprivation on one day (FD: circles) and then food was replaced and the animals were tested the next day in a non-deprived state (ND: triangles). This pattern was followed for four days (2 days deprived, 2 days non-deprived) at each concentration (ascending series). On 7 occasions involving 6 mice, data was lost due to a computer problem. For 5 of these mice, the licks from the complementary day were used instead of the mean of the two days in the analysis. For the sixth mouse, however, the computer problem happened on both days of the same condition and so this mouse had to be excluded from the analysis. In addition, one mouse was excluded from the analysis because it did not consistently sample the stimulus across sessions. In all cases when mice had to be removed from the analysis, their littermates were also excluded. All of these mice had been previously tested in brief access tests with sugars, Na-saccharin, and Polycose. In a three-way ANOVA (genotype × deprivation state × concentration) of total licks for T1R2 KO mice and their WT controls, there was no significant main effect of genotype (F(1,14)=0.008., p=0.93) and no significant genotype × concentration (F(3,42)=1.27, p=0.30), genotype × deprivation state (F(1,14)=0.043, p=.84), or genotype × deprivation state × concentration (F(3,42)=0.60, p=0.62) interactions. In a three-way ANOVA (genotype × deprivation state × concentration) of total licks for T1R3 KO mice and their WT controls, there was no significant main effect of genotype (F(1,16)=0.188, p=0.67) and no significant genotype × concentration (F(3,48)=0.928, p=0.43), genotype × deprivation state (F(1,16)=0.45, p=0.51), or genotype × deprivation state × concentration (F(3,48)=1.086, p=.36) interactions.

Similar articles

Cited by

References

    1. Ackroff K, Manza L, Sclafani A. The rat's preference for sucrose, Polycose and their mixtures. Appetite. 1993;21:69–80. - PubMed
    1. Adler E, Hoon MA, Mueller KL, Chandrashekar J, Ryba NJP, Zuker CS. A novel family of mammalian taste receptors. Cell. 2000;100:693–702. - PubMed
    1. Bachmanov AA, Beauchamp GK. Amino acid and carbohydrate preferences in C57Bl/6ByJ and 129P3/J mice. Physiol Behav. 2008;93:37–43. - PMC - PubMed
    1. Bachmanov AA, Li X, Reed DR, Ohmen JD, Li S, Chen Z, Tordoff MG, de Jong PJ, Wu C, West DB, Chatterjee A, Ross DA, Beauchamp GK. Positional cloning of the mouse saccharin preference (Sac) locus. Chem Senses. 2001;26:925–933. - PMC - PubMed
    1. Bachmanov AA, Tordoff MG, Beauchamp GK. Sweetener preference of C57BL/6ByJ and 129P3/J mice. Chem Senses. 2001;26:905–913. - PMC - PubMed

Publication types

Substances