Review
. 2011 May;30(3):167-87.
doi: 10.1016/j.preteyeres.2011.02.003. Epub 2011 Mar 2.

Nonarteritic anterior ischemic optic neuropathy (NAION) and its experimental models

Affiliations
Review

Nonarteritic anterior ischemic optic neuropathy (NAION) and its experimental models

Steven L Bernstein et al. Prog Retin Eye Res. 2011 May.

Abstract

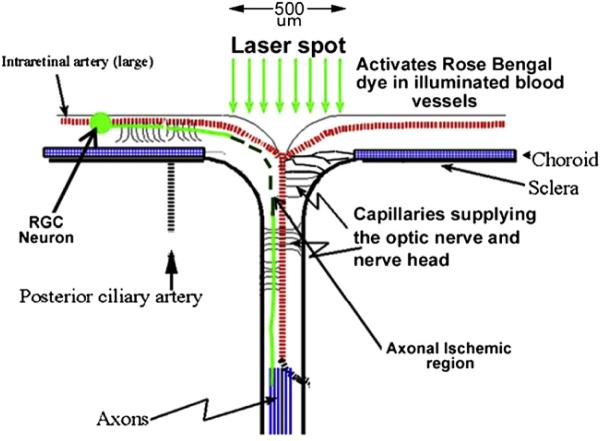
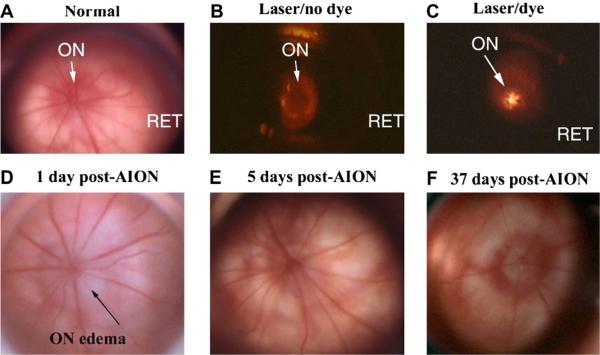
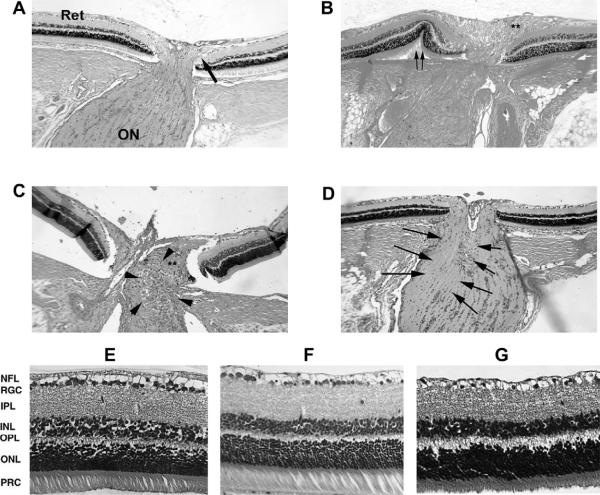
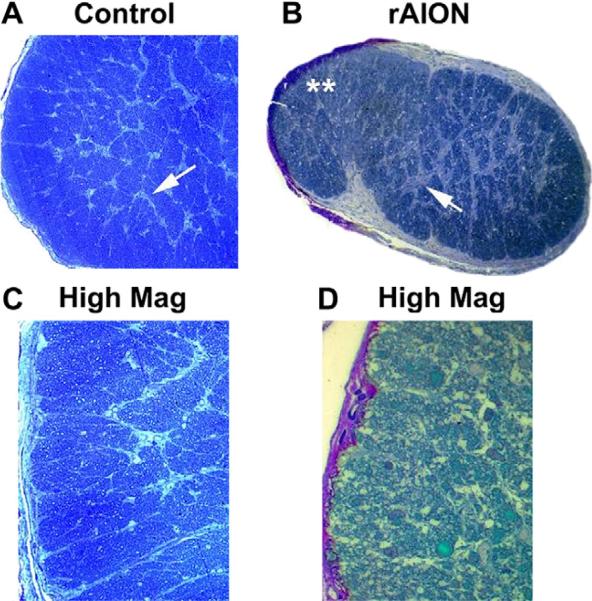
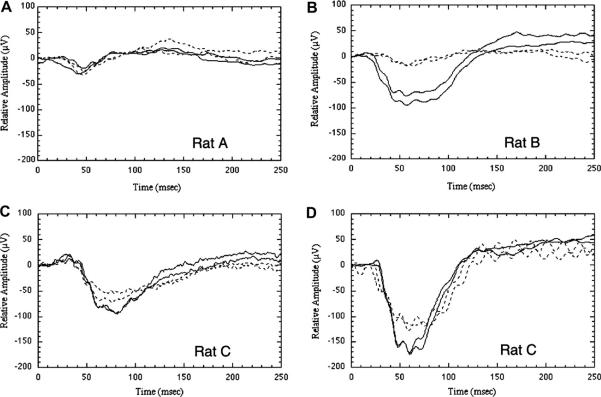
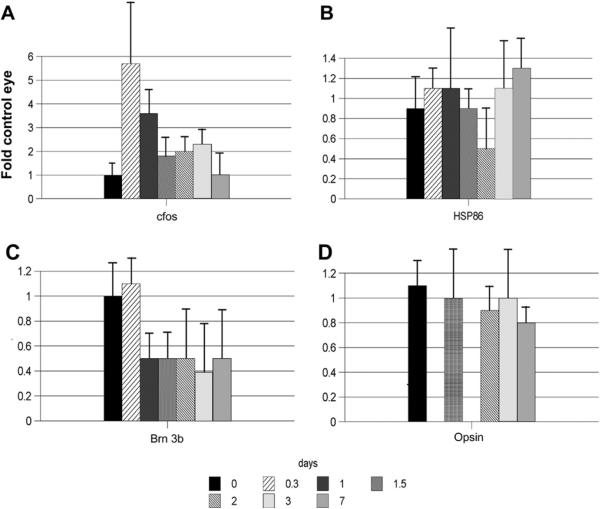
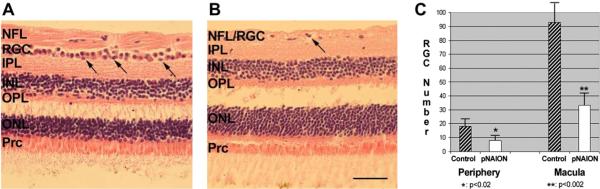
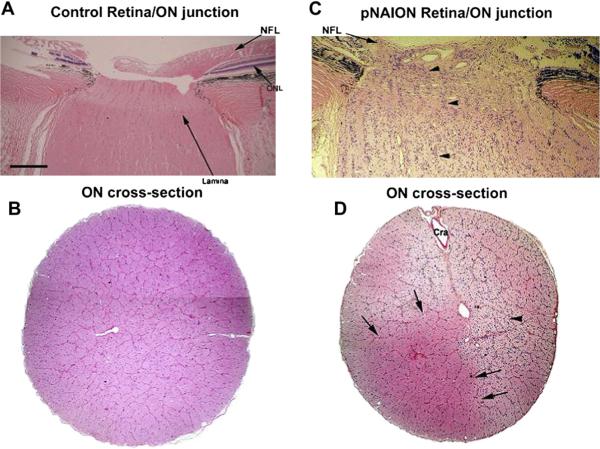
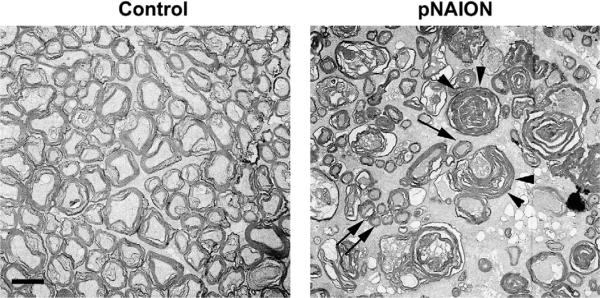
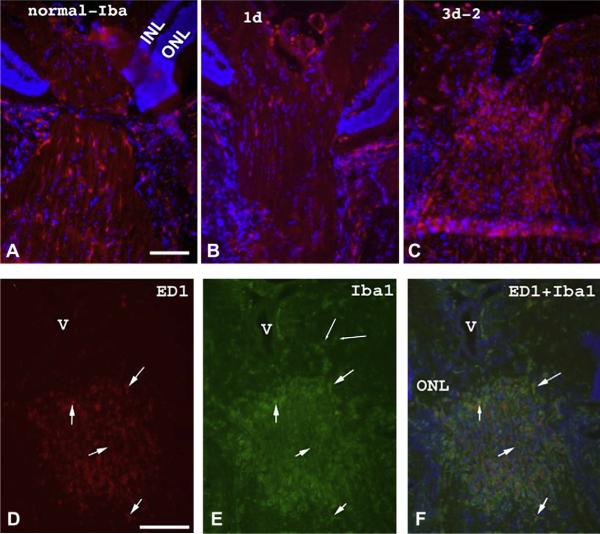
Anterior ischemic optic neuropathy (AION) can be divided into nonarteritic (NAION) and arteritic (AAION) forms. NAION makes up ~85% of all cases of AION, and until recently was poorly understood. There is no treatment for NAION, and its initiating causes are poorly understood, in part because NAION is not lethal, making it difficult to obtain fresh, newly affected tissue for study. In-vivo electrophysiology and post-mortem studies reveal specific responses that are associated with NAION. New models of NAION have been developed which enable insights into the pathophysiological events surrounding this disease. These models include both rodent and primate species, and the power of a 'vertically integrated' multi-species approach can help in understanding the common cellular mechanisms and physiological responses to clinical NAION, and to identify potential approaches to treatment. The models utilize laser light to activate intravascular photoactive dye to induce capillary vascular thrombosis, while sparing the larger vessels. The observable optic nerve changes associated with rodent models of AION (rAION) and primate NAION (pNAION) are indistinguishable from that seen in clinical disease, including sectoral axonal involvement, and in-vivo electrophysiological data from these models are consistent with clinical data. Early post-infarct events reveal an unexpected inflammatory response, and changes in intraretinal gene expression for both stress response, while sparing outer retinal function, which occurs in AAION models. Histologically, the NAION models reveal an isolated loss of retinal ganglion cells by apoptosis. There are changes detectable by immunohistochemistry suggesting that other retinal cells mount a brisk response to retinal ganglion cell distress without themselves dying. The optic nerve ultimately shows axonal loss and scarring. Inflammation is a prominent early histological feature. This suggests that clinically, specific modulation of inflammation may be a useful approach to NAION treatment early in the course of the disease.


Figures

Fig. 1
Fig. 1
Fundus photograph of an eye with NAION. The optic nerve (ON) and retina (Ret) are shown. There is obvious disk edema (arrowheads), with slight disk pallor. Venous dilation is apparent (thin arrow), and a disk hemorrhage (large arrow) is visible. A small intraretinal hemorrhage is also present (white arrow).
Fig. 2
Fig. 2
10× Photograph of a primate lamina cribrosa as viewed from the vitreous cavity.
Fig. 3
Fig. 3
Longitudinal section (10× magnification) of normal primate optic nerve showing prelaminar (Pre), Laminar (Lam) and Retrolaminar (Post) portions of the nerve.
Fig. 4
Fig. 4
Optic nerve (ON) vasculature. Short posterior ciliary arteries perforate through the sclera (intrascleral region) around the optic nerve and supply the choroid, as well as forming an anastomotic vascular circle the circle of Zinn-Haller (ZH), which contributes to the vascular supply of the anterior ON. ON capillaries (ONCs) are supplied from the ZH and anastomose with choroidal vessels, as well as intraretinal capillaries in the region of the optic nerve. ON capillaries posterior to the lamina are also supplied by pial vessels near the ON sheath and also contributed from the central retinal artery (CRA) and central retinal vein (CRV). These large central vessels ultimately supply the inner retina. Figure modified from (Lieberman et al., 1976).
Fig. 5
Fig. 5
Comparison of scanning electron micrographs of ON capillary supply in Human (A), Rat (B) and Mouse (C). In humans, ON capillaries are largely derived from feeder branches (arrows) derived from the choroidal vasculature (Chor) surrounding the optic nerve (ON). Rats have a similar ON capillary structure largely derived from the choroid (Chor). In mice, the ON capillary structure is much sparser, with few capillaries draining into the central retinal vein (V). Data from (Human: Olver and McCartney, (1989); Rat: Morrison et al., (1999); Mouse: May and Lutjen-Drecoll, (2002). Scale bar: 1 micron.
Fig. 6
Fig. 6
Rat fundus contact lens. The contact lens is 8 mm wide (Panel A), with a flat front surface. When applied with a coupling agent such as methylcellulose, the retina and optic nerve can be easily visualized (panel B), and treated, without compromising retinal circulation.
Fig. 7
Fig. 7
rAION induction schematic. A contact lens is placed on the rodent cornea, enabling clear visualization of the retina and optic disk. A 500-micron diameter laser spot (focal laser illumination) is used to irradiate the optic disk, largely sparing the surrounding retina and vessels. Laser-activated dye generates singlet oxygen that, in turn, causes thrombosis of the capillaries supplying the ON axons (axonal ischemic region). Axonal ischemia is limited to the exposure site.
Fig. 8
Fig. 8
Comparison of retina and disk before, during and after rAION induction. Slit- lamp biomicroscopic view (high magnification) seen with rat fundus contact lens. A. control (pre-induced) rat optic nerve (ON) and retina RET. The ON is flat against the retina. Radial retinal vessels emerge from the ON to supply the inner retina. B. Laser exposure without RB dye administration. The ON is dark. C. Laser exposure after RB dye administration. The central vessels glow with a golden color, indicating dye activation. D. ON 1 day post-induction. ON edema is present, with ON pallor and obscuration of the disk margin. Retinal vascular dilation occurs in vessels emerging from the disk, suggesting that intrascleral ON edema has caused vascular compression, similar to that seen in human NAION. E. ON appearance 5 days post-induction. ON edema has resolved, with nearly normal appearance. F. ON appearance 37 days post-induction. The ON disk is pale and apparently reduced in size, suggesting atrophy and loss of vascularization. Choroidal vascularization surrounding the ON is intact.
Fig. 9
Fig. 9
Retina and optic nerve histological changes following rAION. A. Control nerve: The retina (Ret) is flat against the sclera, and the RGC-axonal fibers makes a 90° turn to enter the optic nerve (ON). B. rAION nerve 1d post-induction: there is optic nerve edema (double asterisks), with peripapillary retinal displacement (double arrows). C. Optic nerve 3 days post-rAION. There is an inflammatory cellular infiltrate. D. Optic nerve 21 days post-rAION. There is an asymmetric (one side of the ON; indicated by arrows) loss of oligodendrocytes columns, with residual infiltrate. E. Normal retina: there is a dense monolayer of retinal ganglion cells (RGCs). F. Retina from animal treated with laser without RB dye. No RGC loss is seen 90 days following rAION induction. G. Retina 90 days post-rAION. There is considerable loss of RGCs, without detectable change in the INL or ONL, and a thinning of the NFL layer. (A–D: 100× magnification, E–G: 200× magnification).
Fig. 10
Fig. 10
Changes in the ON post- rAION induction. Toludine blue-stained sections. A. Control. The normal rat ON contains myelinated RGC axons tightly packed in between thin septae (panel A; arrow). C. Control, high magnification. Axons are divided into septated bundles. B. rAION, 3 months post-induction. There is reduced overall volume, with increased septal thickening (panel B; arrow). Panel D. High magnification of rAION-induced ON reveals axon loss and disruption within individual axonal bundles, with scarring. Magnification A,B: 40×. Magnification C, 60×; Magnification D; 100×.
Fig. 11
Fig. 11
VEPs in rAION. rAION was induced in the right eye of each rat; the untreated left eye served as a control. Animals were euthanized at various times following induction. Differences in amplitude between individual panels are not comparable. In all panels, solid traces represent the control (left) eye, dotted traces the experimental (right) eye. The two similar traces in each panel are duplicate recordings. (A) Responses in an animal 1 day after laser irradiation of the right eye with no photoinducible dye (positive control). VEP amplitudes are very similar in both eyes. (B) There is a large reduction in the VEP of the treated eye 1 day following maximum rAION induction. (C) VEPs from a different animal recorded 3 days after rAION induction. A 23–28% decrease in amplitude is present in the experimental eye. (D) Long-term changes in the same rat (rat C) 45 days after rAION induction. The experimental eye continues to show an approximate 23–28% decrease in amplitude.
Fig. 12
Fig. 12
rAION-induced changes in retinal gene expression: Temporal analysis. rAION induction was performed to predicted 50% RGC loss (n = 5 animals/group). Total RNA was isolated, with rq-PCR analysis done at 7 time points (0–7 days). Genes shown: cfos (immediate early stress response); Opsin (rod photoreceptor); Brn 3b (POU domain transcription factor expressed in the retina exclusively in RGCs); HSP86 (a chaperone highly expressed in RGCs, but also expressed in all retinal cells). There is early upregulation (5-fold) of retinal cfos expression which quickly declines by 2 days post-induction. Rod opsin levels do not vary significantly. In contrast, Brn 3b shows a ~50% decline by one day post-induction. The HSP86 response is more complex, with an apparent bimodal change in expression.
Fig. 13
Fig. 13
Quantitative comparison of L-type calcium channel subunit expression in rat, monkey and human ON. A. Real-time quantitative PCR (rq-PCR) results for mRNA quantification of alpha 1A and alpha 1D. L-type calcium channels in rat, monkey and human ON. There is approximately 10-fold less (in monkey ON) and 5-fold less (in human ON) α1A and α1D calcium channel mRNA sequence than in the rat. B. Western analysis of human, monkey and rat ON homogenate, using antibody against the α1D subunit of the L-type calcium channel. The rat ON has a higher concentration of the α1D subunit of the L-type calcium channel, than do either primate species. Inset lower band: Actin loading.
Fig. 14
Fig. 14
Intraretinal changes in protein expression. a–c: Brn-3b expression. d–f: HSP86 (HSP90α) expression. a. Baseline Brn-3b retinal expression. Brn-3b is concentrated in cells in the retinal ganglion cell (RGC) layer (arrows). Low background activity in the INL is due to cross-reactivity with other forms of Brn. b. Three days post-induction. Brn-3b protein in the RGC layer is reduced but still present. c. Seven days post-induction. There is loss of Brn-3b protein in many of the cells in the RGC layer, with continued strong expression in a few cells in this layer (arrow). d. HSP86 baseline expression. HSP86 is expressed at high levels in cells in the RGC layer (double arrows) and as a band in the outer plexiform layer (OPL). e. Three days post-induction. There is accumulation of HSP86 in individual swollen cells in the RGC layer (double arrowheads). There is a loss of HSP86 signal in the area of the OPL, with distribution of the signal throughout the retina. f. Seven days post-induction. HSP86 protein has disappeared in many of the cells in the RGC layer, with continued strong expression in a few cells in this layer (double arrows). There is reconstitution of the HSP86 signal in the OPL. NFL, nerve fiber layer; IPL, inner plexiform layer; INL, inner nuclear layer; ONL, outer nuclear layer; PRC, photoreceptors. Magnification: A–C: 400×, D–F: 200×.
Fig. 15
Fig. 15
Appearance of CD1 mouse retina and optic nerve pre- and post-rAION induction. A. Pre-induction (naïve retina). The optic nerve (ON) is slightly grayish/translucent, with a reddish halo of choroidal vessels (arrowheads). The choroid is visible beneath the transparent retina (Ret). B. Animal 1, 1d post-induction. The optic nerve is pale, with obscuration of the optic nerve/retina junction (arrows). There is loss of the reddish choroidal ring around the ON. C. Animal 2, 1d post-induction. There is ON pallor and obscuration of the vessels emerging from the ON (ON edema; arrows). The zone of whitening extends beyond the ON (arrowheads), with obscuration of the choroidal vasculature beneath the retina.
Fig. 16
Fig. 16
rAION-induced RGC loss in a Thy1-CFP transgenic mouse line. Each retina is divided into quadrants (1–4). A. Control retina. CFP(+) RGCs form a `starry sky' pattern against the flattened retina, with CFP(+) axons projecting toward the optic nerve (ON). B. retina 30 days post-rAION induction (12 s). Regional CFP(+) RGC loss is apparent in quadrant 2. Overall, this animal had a 30% Thy-1 (CFP) RGC loss, determined by quantitative stereology. C. Retina 30 days post-rAION induction (12 s). There is fairly diffuse 85% RGC loss. Panels D–F: Magnified views of panels A–C showing in more detail the RGC axon patterns seen in panels A–C. D. Asymmetric axon bundles (A×B) are visible in the control retina as axons approach the ON. E. Axon pattern of retina shown in panel B. There is a regional preservation of axon bundles (indicated by the arrowheads), with decreased density elsewhere. F. Axon pattern of retina shown in panel C. There is a diffuse loss of axons, with a single large preserved axon bundle indicated by arrowheads. Scale bar: 500 microns.
Fig. 17
Fig. 17
Chemical vs immunohistochemical identification of β-gal (LacZ) expression in cfos (lacZ) transgenic mouse retina 1d post-rAION induction. A and B: Chemical analysis. Individual blue cells (LacZ (+)) are apparent in the RGC layer cross-section and are scattered throughout the RGC layer when seen in flat-mount (arrows). Lower panels: LacZ-immuno histochemical identification in a thy-1(CFP) X cfos(lacZ) double transgenic. 1d post-induction. Many of the RGC layer cells (CFP (+) RGCs) are also lacZ+ when stained for antibody to bacterial β-galactosidase. lacZ immunoreactivity is present regionally, suggesting regional RGC-axonal stress. Scale bar: 50 microns.
Fig. 18
Fig. 18
Appearance of nonhuman primate (NHP) retinae prior to, and 1 day post-pNAION induction. Left-hand numbers (P25 and Q11) refer to individual NHP identities. A and C: baseline photos (prior to induction). A. Pre-induction, (10 s). B. pNAION, 10 s induction. There is significant optic nerve edema (long arrow) and pallor. Mild venous tortuosity is present, along with intraretinal flame and blot hemorrhages. The macular pigment spot is prominent. C. Pre-induction (7 s). The optic nerve and macula are indicated. D. pNAION, 7 s induction. Disk hemorrhages and intraretinal blot and flame hemorrhages are present. The optic nerve is pale and edematous, with disk hemorrhages.
Fig. 19
Fig. 19
VEPs (panels A and D) and pERGs (panels B and E) recorded from a rhesus monkey 1 week (top) and 9 weeks (bottom) following induction of pNAION. Results for the experimental eye (red lines) and control eye (blue lines) are plotted. The VEP is reduced by about 30% in the induced eye at 1 week and does not show further decline at 9 weeks. Conversely, the pERG is normal at 1 week post-induction, but shows a large loss in the N95 component (originating in spiking cells) and a smaller loss in P50 (from a combination of spiking and non-spiking cells) at 9 weeks post-induction, indicating the expected delayed impairment of ganglion cell function. The panels on the right are ganzfeld ERGs recorded 5 h (top panel C) and 13 weeks (Bottom panel F) after induction. The results indicate that there were no gross short-term or long-term pre-ganglion cell changes in the retina as a result of laser induction.
Fig. 20
Fig. 20
VEP and pERG results from NHP Q11. Relative amplitude (experimental eye/control eye) is plotted as a function of time. The VEP amplitude is affected first, and in this animal, shows a 50–60% loss compared to the fellow, control eye. VEP loss did not continue to worsen, nor did it appreciably recover. Between 1 and 2 weeks post-induction, the pERG amplitude began to decrease, with the N95 component showing a larger reduction than the P50 component. This finding may indicate a longer time window for partial treatment of NAION.
Fig. 21
Fig. 21
pNAION-associated histological changes in the retina. H&E staining. A. Control macular section. The RGC layer is packed with cells, with a double layer in some areas (arrows). The nerve fiber layer (NFL) is thick. B. Macular region 90 days post-pNAION. There is a loss of RGCs, with a few remaining nuclei (arrow). The NFL thickness is reduced. All other retinal layers are unchanged in both nuclear numbers and thickness. C. RGC quantification in peripheral region and macula. There is a statistically significant loss of RGCs in the superior retinal quadrant of the pNAION animal, compared with the control retina (one tailed t test, p < 0.02). RGC loss is greatest in the macula, where there is an average 65% RGC loss (p < 0.002) (mean ± s.d. of 6 sections/region). Scale bar: 50 microns.
Fig. 22
Fig. 22
pNAION-associated histological changes in the Rhesus macaque lamina and optic nerve. A. Normal (control) retina:ON junction. H and E staining. The laminar region appears slightly pale (long arrow), the nerve fiber layer (NFL) is thick. There is a regular columnar organization of the RGC-axonal bundles from the lamina, through the distal ON regions. B. ON cross-section. The axonal bundles are regular, and there is a suggestion of the septae surrounding the axons. C. pNAION-induced retina:ON junction, 75 days post-induction. The NFL is thinned (panel C; indicated by arrow). There is disruption of the normal columnar structures, with increased cellularity. Columnar organization is regionally maintained (area indicated by arrowheads). D. 75 days pNAION-induced, ON cross-section. There is a collapse of the normal septal bundles in many areas, and increased cellularity (arrowhead). The central artery is indicated (Cra). There is a normal appearing region, with reduced cellularity and preservation of the normal septated bundles (indicated by arrows). Scale bar: A–D, 500 microns.
Fig. 23
Fig. 23
Comparison of ON axonal ultrastructure in primate control and pNAION-affected eyes. Control: Axons are myelinated and packed in septated bundles. The axons are of different diameters, ranging from ~0.5–2 microns in the current figure. pNAION: There is axonal loss, with post-infarct demyelination and axonal degeneration (arrowheads). Intact, smaller diameter axons are present in small groups (double arrows) and also seen singly in between groups of degenerating large diameter axons (arrow). Scale bar: 1 micron.
Fig. 24
Fig. 24
Early appearance of inflammatory cells in rat ON following rAION induction. Panels A–C: IBA-1 (ionized calcium channel protein) immunostaining. A. Control retina/optic nerve. IBA-1+ microglia are scattered randomly throughout the ON, with occasional cells in the retina. B. 1 day post-induction. IBA-1+ cells are apparent in the retinal vessels, as well as the choroid, surrounding the area of the primary infarct. C. 3 days post-induction. There is infiltration of IBA-1+ cells in the ON region of the infarct. D–F: Early invasion and localization of extrinsic macrophages following rAION. D. ED1 immunoreactivity. ED1+ cells are detectable in the center of the rAION lesion at three days post-induction. E. IBA-1 immunoreactivity. F. ED1/IBA-1 colocalization. The center of the rAION lesion is infiltrated by extrinsic (blood-borne) macrophages early post-induction. Scale bars: A,D: 50 microns.
Fig. 25
Fig. 25
Post-pNAION changes in inflammatory cell infiltration in the laminar region. A and B: H&E-stained cross-sections of nonhuman primate laminar regions. A. Control lamina. The retina is visible to the left, with the optic nerve on the right. There is a columnar organization in the normal lamina, with cellularity distributed between the eosinophilic columns. B. Lamina of a pNAION-induced eye (75 days post-induction). There is disruption of the normal columnar organization, and increased cellularity. C–E: confocal analysis of inflammatory cells in the normal lamina. C. DAPI staining. Normal columnar structure of nuclei. D: Inflammatory (IBA-1) cells. There are a few scattered IBA-1+cells across the lamina. E. Merged image. F–H: confocal analysis of inflammatory cells in the laminar region of a pNAION-induced (75d) eye. There are is disruption of the normal columnar structure, with infiltrration of many IBA-1+ cells across the lamina. Ret: retia. Lam: lamia. ON: optic nerve. Scale bar panel C: 50 microns.

References

    1. Ahmed F, Brown KM, Stephan DA, Morrison JC, Johnson EC, Tomarev SI. Microarray analysis of changes in mRNA levels in the rat retina after experimental elevation of intraocular pressure. Invest. Ophthalmol. Vis. Sci. 2004;45:1247–1258. - PubMed
    1. Albrecht MC. Comparative anatomy of the optic nerve head and inner retina in non-primate animal models used for glaucoma research. Open Ophthalmol. J. 2008;2:94–101. - PMC - PubMed
    1. Arnold AC, Hepler RS. Natural history of nonarteritic anterior ischemic optic neuropathy. J. Neuroophthalmol. 1994;14:66–69. - PubMed
    1. Arnold AC, Badr MA, Hepler RS. Fluorescein angiography in nonischemic optic disc edema. Arch. Ophthalmol. 1996;114:293–298. - PubMed
    1. Arnold AC. Pathogenesis of nonarteritic anterior ischemic optic neuropathy. J. Neuroophthalmol. 2003;23:157–163. - PubMed

Publication types